


I came up with the idea for a digital clock where the background was divided into 1,440 blocks — one for each minute of the day. Initially all blocks are shaded, but as each minute passes, the block representing that minute would brighten up.
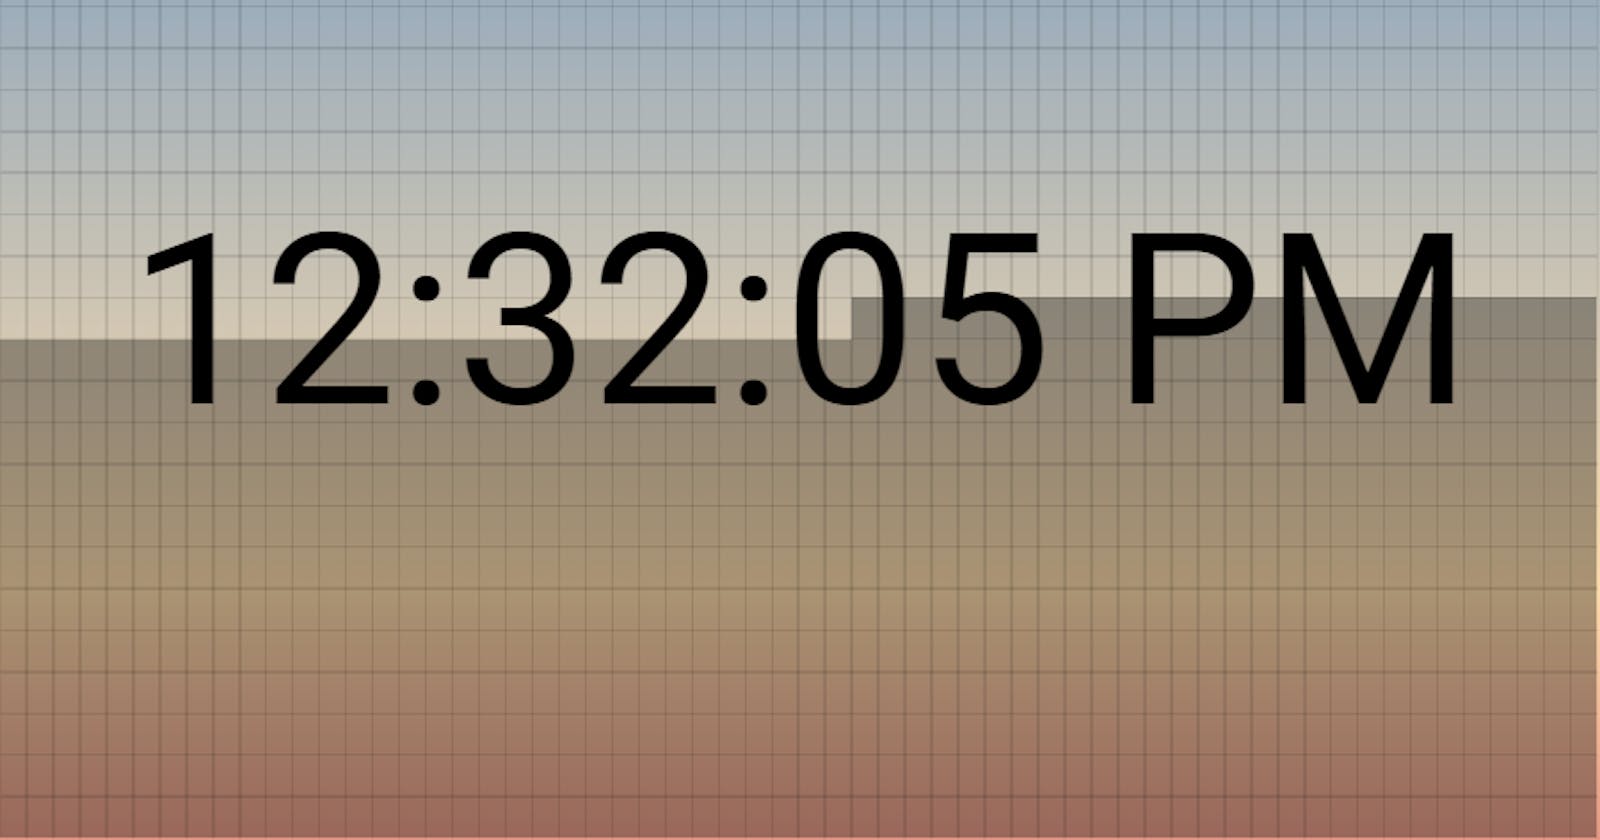
I ended up building it and giving the blocks a sunrise-like gradient look. I call it the Sunrise Block Clock. Follow along and I’ll show you how it’s made.

I started out by creating index.html with boilerplate HTML.
<!doctype html>
<html lang="en">
  <head>
    <title>Sunrise Block Clock</title>

    <meta charset="utf-8">
    <meta name="viewport" content="width=device-width, initial-scale=1, shrink-to-fit=no">
  </head>
  <body>

  </body>
</html>
In the <head> section, I added…
the Roboto font from Google
A custom stylesheet
<head>
  <!-- snip -->

  <link rel="stylesheet" href="https://fonts.googleapis.com/css?family=Roboto">
  <link rel="stylesheet" href="app.css">
</head>
In the <body> section, I added…
An
<svg>element to build the clock uponVue.js
A custom JS file
<body>
  <svg id="chart"></svg>

  <script src="https://cdnjs.cloudflare.com/ajax/libs/vue/2.3.4/vue.min.js"></script>
  <script src="app.js"></script>
</body>
Then, I created app.css with some basic styles.
body {
  text-align: center;
  padding: 50px;
  font-family: 'Roboto', sans-serif;
}

svg text {
  font-size: 90px;
}

p {
  width: 600px;
  margin: 20px auto;
}
Next, I created app.js with a Vue app skeleton.
new Vue({
  el: '#chart',

  filters: {},

  data: {},

  computed: {},

  mounted() {},

  methods: {},
});
The <svg> element will get it’s width and height from Vue. In app.js:
data: {
  width: 600,
},

computed: {
  height() { return this.width / 1.6; },
},
And in index.html:
<svg id="chart"
     :width="width"
     :height="height">
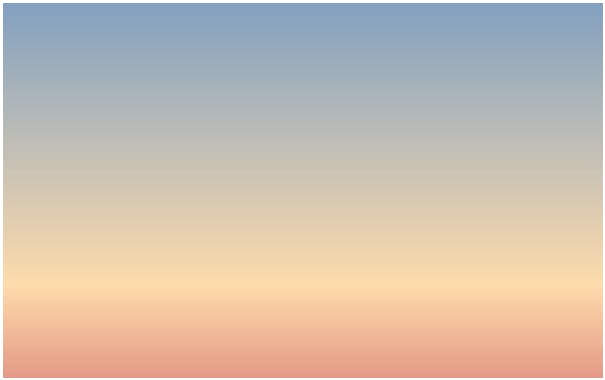
The entire <svg> element’s background gets filled with a sunrise-like gradient.
<svg <!-- snip --> >
  <defs>
    <linearGradient id="sunrise" x1="0" y1="0" x2="0" y2="1">
      <stop offset="0%" stop-color="#82A1C0" />
      <stop offset="75%" stop-color="#FEDCAC" />
      <stop offset="100%" stop-color="#E59A87" />
    </linearGradient>
  </defs>

  <rect :width="width"
        :height="height"
        fill="url(#sunrise)" />
</svg>
Inside the <svg> and after this background<rect>, I created a <g> for each hour of the day.
<g v-for="hIndex in 24"></g>
Inside that, I created a <rect> for each minute in the hour. These will be the “blocks”. They all have a semi-transparent outline (stroke).
<g v-for="hIndex in 24">
  <rect stroke="rgba(0, 0, 0, 0.05)"
        v-for="mIndex in 60" />
</g>
In order to position the blocks, I needed a way to get the width and height for each block.
There will be 24 rows of 60 blocks each. Basically, the width should be the total width divided by 60 and the height should be the total height divided by 24.
We can get these values with computed properties.
computed: {
  /* snip */

  minuteWidth() { return this.width / 60; },
  minuteHeight() { return this.height / 24; },
},
Now the width and height can be set.
<rect stroke="rgba(0, 0, 0, 0.05)"
      v-for="mIndex in 60"
      :width="minuteWidth"
      :height="minuteHeight" />
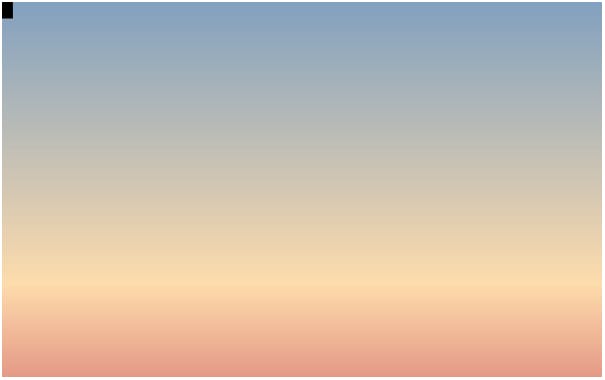
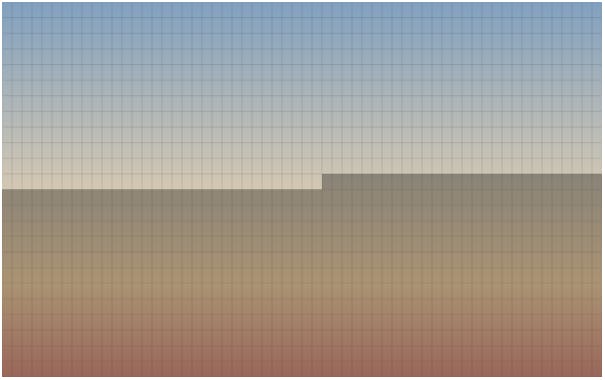
The blocks are all drawn, but stacked on top of each other in the upper left corner. I had to use a little bit of math to position them along the x and y grid.
<rect
  <!-- snip -->

  :x="(mIndex - 1) * minuteWidth"
  :y="(hIndex - 1) * minuteHeight" />
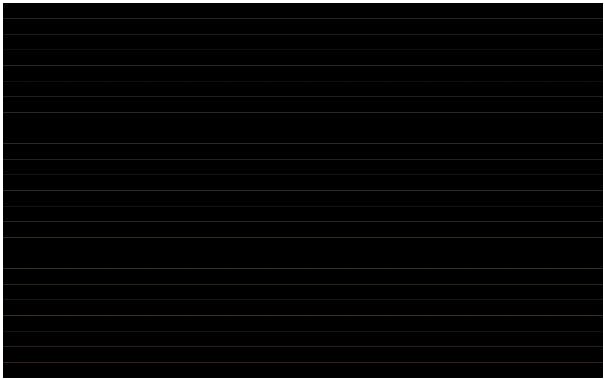
Looking good so far. The blocks are positioned correctly. At this moment, they are all filled with a black color. Now it’s just a matter of setting that fill color to be more transparent.
Since the transparency of each block depends on the time, I needed to figure out how many minutes have passed since the beginning of the day. This was easy with a computed property.
data: {
  /* snip */

  now: new Date(),
},

computed: {
  /* snip */

  minutesPassed() {
    const beginningOfDay = new Date(
      this.now.getFullYear(),
      this.now.getMonth(),
      this.now.getDate()
    );

    return (this.now - beginningOfDay) / 1000 / 60;
  },
},
The now property is set to the current timestamp (when the app is loaded). Inside minutesPassed(), the beginningOfDay date is set to midnight of the current day.
Subtracting beginningOfDay from this.now gives us the number of milliseconds that have passed since the beginning of the day. Dividing this by 1000 and then again by 60 gives us the number of minutes that have passed since the beginning of the day.
Now we can set the fill value on each block based on this value.
<rect
  <!-- snip -->

  :fill="((hIndex * 60) + mIndex) > minutesPassed ? 'rgba(0, 0, 0, 0.33)' : 'none'" />
This line is a little complex but it basically means that if the current blocks minute representation is greater than the number of minutes that have passed since the beginning of the day, make it semi-transparent. Otherwise, make it fully transparent.
To actually display the time in the middle, I used a <text> element.
<svg <!-- snip --> >
  <!-- snip -->

  <text
    :x="width / 2"
    :y="height / 2"
    text-anchor="middle"
    alignment-baseline="middle">{{ now }}</text>
</svg>
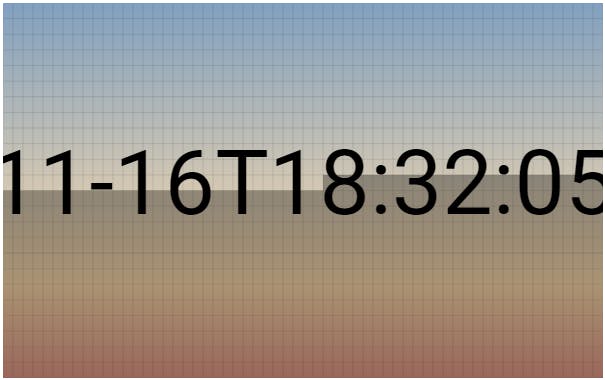
It works, but shows the time in ISO 8601 Extended Format. To make it more usable, I want to show a locally sensitive representation.
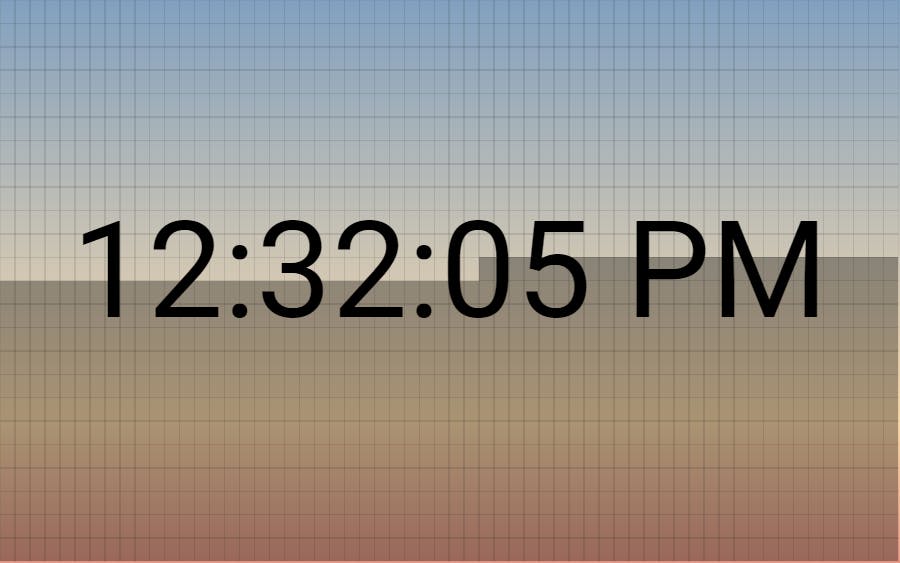
For this, I used a filter. In app.js:
filters: {
  localeTime(d) { return d.toLocaleTimeString(); },
},
And then in index.html:
<text
  :x="width / 2"
  :y="height / 2"
  text-anchor="middle"
  alignment-baseline="middle">{{ now **| localeTime** }}</text>
The clock works great, but is static. To make it update automatically, I first created an updateNow() method.
methods: {
  updateNow() { this.now = new Date(); },
},
And then set an interval to call this method every second once the app is mounted.
mounted() { setInterval(this.updateNow, 1000); },
That’s it! The finished product looks like this: