 Travis Horn
Updating Dynamic Data in D3

D3 uses an enter, update, exit pattern for handling dynamic data. Developers new
to D3 might first encounter it when needing to manipulate more than one element
(e.g. a series of <rect>s or <circle>s).
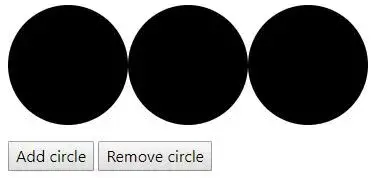
Start out with a simple <svg>
element and two buttons for
adding and removing circles.
<svg width="600" height="120"></svg>

<button id="addCircle">Add circle</button>
<button id="removeCircle">Remove circle</button>
Somewhere on your page, make sure to include D3.js.
<script src="https://d3js.org/d3.v4.min.js"></script>For the sake of this simple example, let’s say we have an array, and want to display a circle for each value in the array.
const data = [1, 1, 1]; // We want to visualize this as 3 circlesEach circle’s radius will be 60 pixels.
const circleRadius = 60;Later on, we’ll need to get the circle diameter. Rather than use a magic number, we’ll define it explicitly.
const circleDiameter = circleRadius * 2;Start a function that will plot our circles. This function accepts a data
argument (what to display) and an svg argument (where to display it).
const plot = (data, svg) => {
  // Plot the circles
};
Inside the plot() function, use D3 to store a reference to all
<circle>s in our chart (even if there aren’t any currently) and bind our
data to them.
const circle = svg.selectAll("circle").data(data);Now, define what happens when a new piece of data enters our dataset:
circle
  .enter()
  .append("circle")
  .attr("cy", circleRadius)
  .attr("cx", (d, i) => circleRadius + i * circleDiameter)
  .attr("r", circleRadius);
Breaking down the code above… when a piece of data enters the dataset:
- Append a new circle
- Set it’s position on the Y axis to match it’s radius
- Set it’s position on the X axis to match it’s radius, plus it’s diameter multiplied by where it appears in the array. This effectively shifts it to the right so no circles overlap
- Set the radius to the defined constant we set earlier
And when a piece of data exits the dataset:
circle.exit().remove();Just remove the <circle> it represents.
The plot() function is done. Let’s use it to plot our data to our svg element.
const svg = d3.select("svg");
plot(data, svg);
You should see three circles.
The buttons don’t do anything right now. But it’s easy to wire them up in JavaScript. First, define the buttons’ actions.
const addCircle = () => {
  if (data.length < 5) data.push(1);
  plot(data, svg);
};

const removeCircle = () => {
  data.pop();
  plot(data, svg);
};
To add a circle, push a new value to the array, then run the plot() function
again. Notice also that I put in an if statement to keep the maximum array
length at 5.
To remove a circle, simply pop the array. This removes the last value from the array. Then plot the data again.
Finally, bind these functions to the click event on the buttons.
document.getElementById("addCircle").addEventListener("click", addCircle);

document.getElementById("removeCircle").addEventListener("click", removeCircle);
Clicking “Add circle” adds a new value to the array, thus a new circle to our chart.
Clicking “Remove circle” removes a value from the array, thus removing a circle from our chart.
The result (with some extra styles and a little code cleanup) can be found in this CodePen.