 Travis Horn
Excel Formula to Scale Data from 0 to 1

Say we have a set of data in column A.
| A |
|---|
| 469 |
| 396 |
| 600 |
| 177 |
| 240 |
| 155 |
| 204 |
| 454 |
| 278 |
| 233 |
And we want to scale the data so that the lowest value equates to 0 and the highest value equates to 1.
If you just want a quick formula to do this, you can copy the line below. However, you may consider reading further to really understand how it works.
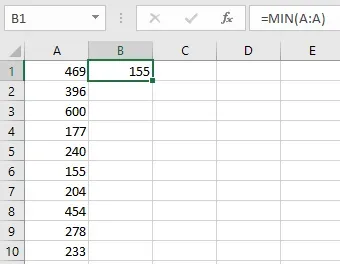
=(A1 - MIN(A:A)) / (MAX(A:A) - MIN(A:A))First, figure out the minimum value in the set.
=MIN(A:A)In this case, it’s 155.
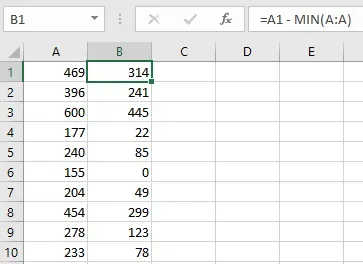
Now for each value, figure out the difference from the minimum.
=A1 - MIN(A:A)Looking at each value…
| Formula | Equation | Result |
|---|---|---|
| =A1 - MIN(A:A) | = 469 - 155 | = 314 |
| =A2 - MIN(A:A) | = 396 - 155 | = 241 |
| =A3 - MIN(A:A) | = 600 - 155 | = 445 |
| =A4 - MIN(A:A) | = 177 - 155 | = 22 |
| =A5 - MIN(A:A) | = 240 - 155 | = 85 |
| =A6 - MIN(A:A) | = 155 - 155 | = 0 |
| =A7 - MIN(A:A) | = 204 - 155 | = 49 |
| =A8 - MIN(A:A) | = 454 - 155 | = 299 |
| =A9 - MIN(A:A) | = 278 - 155 | = 123 |
| =A10 - MIN(A:A) | = 233 - 155 | = 78 |
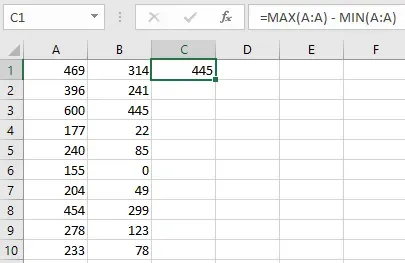
Next, figure out the largest difference. This is simply the different between
MAX(A:A) and MIN(A:A).
| Formula | Equation | Result |
|---|---|---|
| =MAX(A:A) - MIN(A:A) | = 600 - 155 | = 445 |
For each value, calculate what percentage it’s difference is when compared to this maximum difference.
| Formula | Equation | Result |
|---|---|---|
| =(A1 - MIN(A:A)) / (MAX(A:A) - MIN(A:A)) | = (469 - 155) / 445 | = 0.71 |
| =(A2 - MIN(A:A)) / (MAX(A:A) - MIN(A:A)) | = (396 - 155) / 445 | = 0.54 |
| =(A3 - MIN(A:A)) / (MAX(A:A) - MIN(A:A)) | = (600 - 155) / 445 | = 1.00 |
| =(A4 - MIN(A:A)) / (MAX(A:A) - MIN(A:A)) | = (177 - 155) / 445 | = 0.05 |
| =(A5 - MIN(A:A)) / (MAX(A:A) - MIN(A:A)) | = (240 - 155) / 445 | = 0.19 |
| =(A6 - MIN(A:A)) / (MAX(A:A) - MIN(A:A)) | = (155 - 155) / 445 | = 0.00 |
| =(A7 - MIN(A:A)) / (MAX(A:A) - MIN(A:A)) | = (204 - 155) / 445 | = 0.11 |
| =(A8 - MIN(A:A)) / (MAX(A:A) - MIN(A:A)) | = (454 - 155) / 445 | = 0.67 |
| =(A9 - MIN(A:A)) / (MAX(A:A) - MIN(A:A)) | = (278 - 155) / 445 | = 0.28 |
| =(A10 - MIN(A:A)) / (MAX(A:A) - MIN(A:A)) | = (233 - 155) / 445 | = 0.18 |
These results are what we’re looking for.
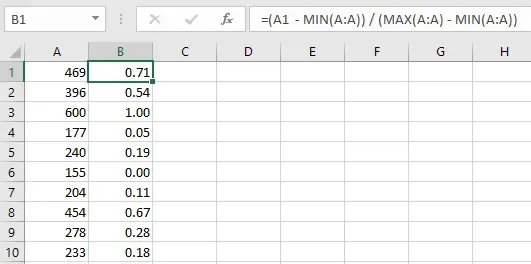
As you can see, the lowest value 155 is scaled to 0.00 while the highest
value 600 is scaled to 1.00. All the other values are proportionately
somewhere in between.
This can be useful when used on multiple columns to normalize the data and make scores or comparisons.
Once again, the final formula is:
=(A1 - MIN(A:A)) / (MAX(A:A) - MIN(A:A))