 Travis Horn
Fraud and Anomaly Detection Using Vectors

If you have a database of financial transactions and need to identify which ones might be fraudulent, where do you begin? Your first instinct might be to write a few simple threshold rules. You look for the most obvious red flags you can think of and write a quick query to catch them:
SELECT
  t.*
FROM transactions t
WHERE
  t.amount > 5000
  AND t.country <> 'US';
There’s a problem here, though. Criminals are rarely careless enough to make transactions that get caught by such a naive check. They aren’t stealing massive amounts all at once. Instead, they try to blend in by making smaller transactions at odd hours that won’t trigger basic threshold alerts.
Our system needs to detect when a transaction feels out of place without
requiring us to write hundreds complex if/else rules.
The best part? You don’t need a dedicated data science platform to do this. Often, you can do it right inside the relational database you already use.
Thinking in Dimensions
Let’s start with a single property: transaction amount. We can plot a series of transactions on a 1-dimensional number line.

You can easily see a tight cluster of $5-$25 purchases, a couple of moderately priced ones, and a single $300 outlier far off to the right.
Now let’s add a second property: time of day. We can plot those exact same transactions on a 2-dimensional grid.
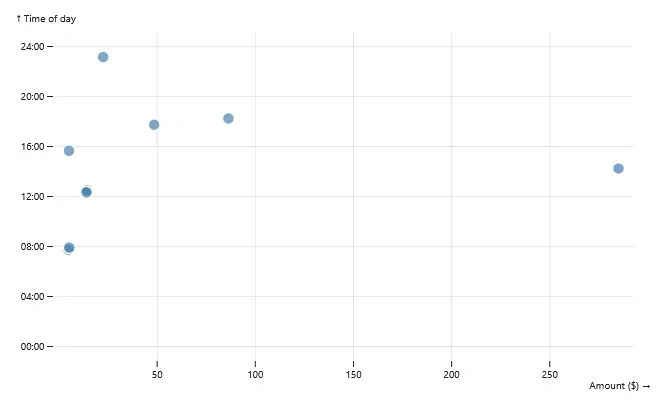
This gives us another dimension to visualize transaction patterns. Most are low-cost and occur during the day, while only a few happen late at night or carry higher price tags.
Let’s take it a step further by adding a third property: distance from home.

Now our transactions are points floating in a 3D space. Regular transactions cluster together: low-priced, daytime, and close to home. Outliers stand out immediately: high-priced, late-night, distant purchases appear far away from the core cluster.
Visually, three dimensions is our limit. Humans can’t picture 4D or beyond, but the math doesn’t change.
Each extra property is just another axis added to our virtual graph.
You’ve likely heard of vectors or vector databases. A vector is simply a
point’s address in that space. It’s an array of numbers representing its
position along every single axis. For example: [4.85, 7.45, 1.2, ...].
From Normal Transactions to Vectors
Numeric properties are easy to plot and calculate distance between. Messy, unstructured data like descriptions, memos, and merchant names are a different story.
Luckily, we have embedding models. They take messy text and translate it
into vectors. Models like OpenAI’s text-embedding-3 are trained on a massive
amount of text. They can capture what a piece of text is conceptually about.
For instance, an embedding model places “Shell” and “Chevron” near each other
because, even though the strings look completely different, the model
understands they are both gas stations.
Storing vectors in your database is straightforward:
- Add a column with the appropriate vector data type. In MariaDB, you can use
VECTOR(1536). - Pass the transaction’s merchant name, description, memo, and other metadata to a local model or an API like OpenAI.
- Save the returned array of numbers to the transaction record.
The vector lives right alongside the rest of your tabular transaction data.
How “Normal” Behavior Clusters
A typical consumer’s financial life forms a “neighborhood” in high-dimensional space. They buy transit passes on weekday mornings. They frequent the same three lunch spots. They pay for the same recurring monthly subscriptions.
Because your database can calculate the mathematical distance between points, transactions that are conceptually similar will have very short distances between them.
Inverting Vector Search for Anomaly Detection
Most vector search use cases look for things that are close together. Anomaly detection flips that logic around.
What happens when a new transaction arrives and its nearest neighbor is miles away?
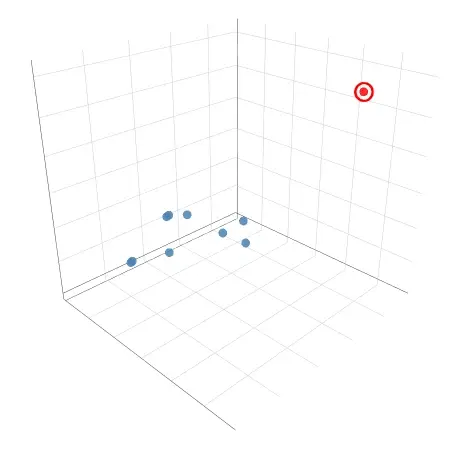
If a transaction lands in an empty, unpopulated region of a user’s coordinate space, it means that user has never done anything conceptually like this before.
Consider a new transaction: $48 at 3:00 AM for a “cryptocurrency gift card exchange.”
At $48, it slips under the radar of standard alert rules. But in vector space, it lands in an empty zone far away from the user’s normal cluster.
That’s an immediate anomaly flag.
How It Looks in Practice
When a new transaction arrives, compute its vector and ask the database for the distance to that user’s closest past transaction:
SELECT
  VEC_DISTANCE_COSINE(embedding, :new_transaction_vector) AS distance
FROM transactions
WHERE
  user_id = :user_id
ORDER BY
  distance ASC
LIMIT 1;
If the nearest neighbor is further away than some safety threshold you set, you can trigger a notification, pause the charge for review, or initiate some other protections.
Not Just a Gimmick
Vector technology isn’t just for AI chatbots or search boxes. It’s a practical, mathematical tool for measuring context and spotting anomalies.
Take a look at your existing database tables. What other events create “clusters” of regular behavior where outliers would be valuable to catch? Think authentication logs, API usage patterns, customer support tickets, or user reviews.
Cover photo by Rick Rothenberg on Unsplash.