 Travis Horn
High Performance Data Visualization in the Browser with DuckDB and Parquet

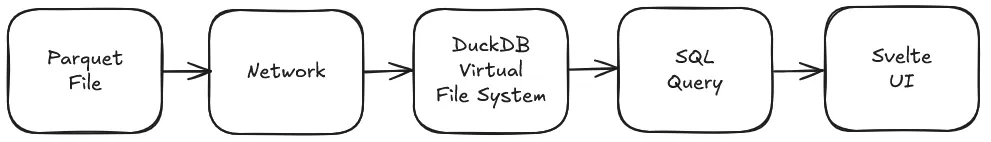
With massive data, frontend visualization often means you either crush the browser with giant JSON payloads or get stuck waiting on slow API endpoints every time a user changes a filter. However, the combination of raw SQL power in DuckDB-Wasm and the high-efficiency compression of Parquet files allows us to pull in and query millions of rows with no network latency. Using these tools, static dashboards become lightning-fast, serverless analytics tools.
In this post, we’re going to build a reactive Svelte 5 application that loads historical NVIDIA stock data and performs real-time SQL analysis right in the browser. We’ll start with a baseline implementation to get DuckDB running, and then evolve the project in three ways:
- a zero-latency dashboard for instant filtering,
- a “bring-your-own-data” feature that lets users analyze local files, and
- a robust cross-filtering visualization using Observable Plot.
By the end, you’ll understand how to handle high-performance data engineering directly in the frontend.
All code in this article can be found on GitHub: travishorn/parquet-browser-parse.
Why Parquet and DuckDB?
Parquet is a columnar storage format designed to make data analysis as efficient as possible. Unlike JSON or CSV, which store data row-by-row, Parquet organizes data by columns. This allows for incredible compression and enables the database to read only the specific parts of the file it needs.
DuckDB is an analytical, in-process database built for speed. While most databases require a server, DuckDB-Wasm brings that entire engine into the browser.
So, Parquet provides the highly optimized storage structure, and DuckDB-Wasm provides the lightning-fast engine to query it.
Follow along as we build a data pipeline from storage to the user’s screen.
The Baseline: Getting It Running
I’m going to use SvelteKit for this project. We can use sv to quickly scaffold
it:
npx sv@latest create parquet-duckdbChange into the new directory:
cd parquet-duckdbInstall the DuckDB-Wasm package:
npm install @duckdb/duckdb-wasmIn vite.config.js, we need to tell Vite not to optimize the DuckDB-Wasm
dependency. We need access to all of the unoptimized files:
export default defineConfig({
    plugins: [sveltekit()],
    optimizeDeps: {
        exclude: ['@duckdb/duckdb-wasm']
    }
});
With the scaffolding out of the way and dependencies installed, run the development server:
npm run devIf you visit http://localhost:5173 in your browser, you’ll see the default SvelteKit app.
For demonstration purposes, we’re using a stock market dataset from Hugging
Face. While DuckDB-Wasm can query these files directly
over the network via HTTP, I’ve downloaded a local copy of the NVIDIA stock file
into the SvelteKit static/ directory to keep development fast and reliable.
Here is the baseline code to get the database initialized and the data
displayed. Replace everything in src/routes/+page.svelte with the following:
<script>
	import { onMount } from 'svelte';
	import * as duckdb from '@duckdb/duckdb-wasm';
	import duckdb_worker from '@duckdb/duckdb-wasm/dist/duckdb-browser-mvp.worker.js?worker';
	import duckdb_wasm from '@duckdb/duckdb-wasm/dist/duckdb-mvp.wasm?url';

	const DATA_URL =
		//'https://huggingface.co/datasets/Xmm/stock-data-dataset/resolve/main/NVDA/train-00000-of-00001.parquet';
		'/train-00000-of-00001.parquet'; // Downloaded from Hugging Face and placed in the `static/` directory of the SvelteKit app

	let db = null;
	let conn = null;

	/**
	 * @typedef {Object} StockRow
	 * @property {string} Date
	 * @property {number} Volume
	 * @property {number} Adj_Close
	 * @property {number} Open
	 * @property {number} High
	 * @property {number} Low
	 */

	/** @type {StockRow[]} */
	let rows = $state([]);
	let loading = $state(true);

	/** @type {null | string} */
	let error = $state(null);

	async function initDB() {
		try {
			const worker = new duckdb_worker();
			const logger = new duckdb.ConsoleLogger();
			db = new duckdb.AsyncDuckDB(logger, worker);

			await db.instantiate(duckdb_wasm);

			await db.registerFileURL('nvda.parquet', DATA_URL, duckdb.DuckDBDataProtocol.HTTP, false);

			conn = await db.connect();

			const result = await conn.query(`
                SELECT
                    Date::STRING AS Date,
                    "Adj Close" AS Adj_Close,
                    Volume,
                    Open,
                    High,
                    Low
                FROM 'nvda.parquet'
                ORDER BY Date DESC
                LIMIT 10;
            `);

			rows = result.toArray().map((r) => r.toJSON());
		} catch (e) {
			console.error(e);
			error = String(e);
		} finally {
			loading = false;
		}
	}

	onMount(() => {
		initDB();
	});
</script>

{#if loading}
	<p>Loading...</p>
{:else if error}
	<p class="text-red-600">{error}</p>
{:else}
	<table>
		<thead>
			<tr>
				<th class="p-2 text-left">Date</th>
				<th class="p-2 text-left">Adj Close</th>
				<th class="p-2 text-left">Volume</th>
				<th class="p-2 text-left">Open</th>
				<th class="p-2 text-left">High</th>
				<th class="p-2 text-left">Low</th>
			</tr>
		</thead>
		<tbody>
			{#each rows as row}
				<tr class="border-b border-gray-300">
					<td class="p-2">{row.Date}</td>
					<td class="p-2">{row.Adj_Close.toFixed(2)}</td>
					<td class="p-2">{row.Volume.toLocaleString()}</td>
					<td class="p-2">{row.Open.toFixed(2)}</td>
					<td class="p-2">{row.High.toFixed(2)}</td>
					<td class="p-2">{row.Low.toFixed(2)}</td>
				</tr>
			{/each}
		</tbody>
	</table>
{/if}
This file is in the main branch of the repository.
The logic breaks down into four simple steps:
- We spin up a Web Worker and the WASM binary. This ensures that all heavy data processing happens on a separate thread, keeping the UI smooth.
- We use
registerFileURLto point DuckDB to our.parquetfile and give it a virtual filename,nvda.parquet. - We run a standard SQL query. Note that we can use SQL aliases and casting
(
::STRING) to clean up the data before it even hits our UI state. - We use Svelte 5’s
$staterune. As soon asconn.query()finishes and we update rows, the table renders automatically.
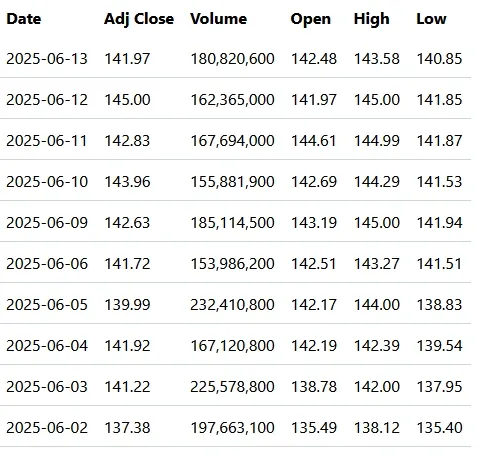
The output in the browser is a simple table.
I’m going to keep a copy of this baseline code in the main branch of my repository. Then, I’ll branch into three different ideas. Starting with…
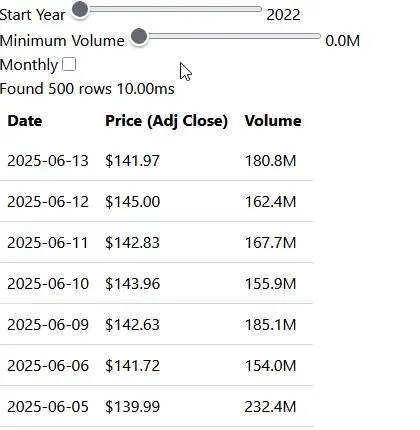
The Zero-Latency Dashboard
Now that we have the data loading, we can make it interactive. In this branch, we allow users to filter the dataset by date and volume or toggle between raw records and monthly aggregates. Because the data is already held in DuckDB’s virtual filesystem, these updates feel instantaneous. No network round-trips are required.
<script>
	import { onMount } from 'svelte';
	import * as duckdb from '@duckdb/duckdb-wasm';
	import duckdb_worker from '@duckdb/duckdb-wasm/dist/duckdb-browser-mvp.worker.js?worker';
	import duckdb_wasm from '@duckdb/duckdb-wasm/dist/duckdb-mvp.wasm?url';

	const DATA_URL =
		//'https://huggingface.co/datasets/Xmm/stock-data-dataset/resolve/main/NVDA/train-00000-of-00001.parquet';
		'/train-00000-of-00001.parquet'; // Downloaded from Hugging Face and placed in the `static/` directory of the SvelteKit app

	/** @type {duckdb.AsyncDuckDB | null} */
	let db = null;

	/** @type {duckdb.AsyncDuckDBConnection | null} */
	let conn = null;

	let startYear = $state(2022);
	let minVolume = $state(0);
	let viewMode = $state('raw');

	/**
	 * @typedef {Object} StockRow
	 * @property {string} Date
	 * @property {number} Price
	 * @property {number} Volume
	 */

	/** @type {StockRow[]} */
	let rows = $state([]);
	let loading = $state(true);

	/** @type {null | string} */
	let error = $state(null);

	let queryTime = $state(0);

	async function runQuery() {
		if (!conn) return;

		const start = performance.now();

		try {
			let sql = '';

			if (viewMode === 'raw') {
				sql = `
                    SELECT
                        Date::STRING as Date,
                        "Adj Close" AS Price,
                        Volume::DOUBLE as Volume
                    FROM 'nvda.parquet'
                    WHERE
                        year(Date) >= ${startYear}
                        AND Volume > ${minVolume}
                    ORDER BY
                        Date DESC
                    LIMIT 500;
                `;
			} else {
				sql = `
                    SELECT
                        strftime(Date, '%Y-%m') AS Date,
                        AVG("Adj Close") AS Price,
                        SUM(Volume)::DOUBLE as Volume
                    FROM 'nvda.parquet'
                    WHERE
                        year(Date) >= ${startYear}
                    GROUP BY
                        1
                    ORDER BY
                        1 DESC;
                `;
			}

			const result = await conn.query(sql);
			rows = result.toArray().map((r) => r.toJSON());
			queryTime = performance.now() - start;
		} catch (e) {
			error = String(e);
		}
	}

	async function initDB() {
		try {
			const worker = new duckdb_worker();
			const logger = new duckdb.ConsoleLogger();
			db = new duckdb.AsyncDuckDB(logger, worker);

			await db.instantiate(duckdb_wasm);

			await db.registerFileURL('nvda.parquet', DATA_URL, duckdb.DuckDBDataProtocol.HTTP, false);

			conn = await db.connect();

			await runQuery();
		} catch (e) {
			console.error(e);
			error = String(e);
		} finally {
			loading = false;
		}
	}

	$effect(() => {
		const state = { startYear, minVolume, viewMode };

		if (conn) {
			runQuery();
		}
	});

	onMount(() => {
		initDB();
	});
</script>

<div>
	<label for="startYear">Start Year</label>
	<input id="startYear" type="range" min="2022" max="2026" bind:value={startYear} />
	<span>{startYear}</span>
</div>

<div>
	<label for="minVolume">Minimum Volume</label>
	<input
		id="minVolume"
		type="range"
		min="0"
		max="500000000"
		step="1000000"
		bind:value={minVolume}
	/>
	<span>{(minVolume / 1000000).toFixed(1)}M</span>
</div>

<div>
	<label for="viewMode">Monthly</label>
	<input
		type="checkbox"
		checked={viewMode === 'monthly'}
		onchange={() => (viewMode = viewMode === 'raw' ? 'monthly' : 'raw')}
	/>
</div>

<div>
	<span>Found {rows.length} rows</span>
	<span>{queryTime.toFixed(2)}ms</span>
</div>

{#if loading}
	<p>Loading...</p>
{:else if error}
	<p class="text-red-600">{error}</p>
{:else}
	<table>
		<thead>
			<tr>
				<th class="p-2 text-left">{viewMode === 'raw' ? 'Date' : 'Month'}</th>
				<th class="p-2 text-left">Price ({viewMode === 'raw' ? 'Adj Close' : 'Avg'})</th>
				<th class="p-2 text-left">Volume</th>
			</tr>
		</thead>
		<tbody>
			{#each rows as row}
				<tr class="border-b border-gray-300">
					<td class="p-2">{row.Date}</td>
					<td class="p-2">${row.Price.toFixed(2)}</td>
					<td class="p-2">{(row.Volume / 1000000).toFixed(1)}M</td>
				</tr>
			{/each}
		</tbody>
	</table>
{/if}
This file is on the zero-latency-dashboard branch of the repository.
This version builds on the baseline with a few key changes.
First, we use a Svelte $effect to watch our input variables (startYear,
minVolume, viewMode). Whenever a user moves a slider, the $effect triggers
runQuery() automatically.
Notice that the query is no longer static. We use standard SQL logic to switch
between a “raw” view and a “monthly” view. In the monthly mode, DuckDB handles
the heavy lifting of calculating averages (AVG) and sums (SUM) on the fly.
We’re also tracking performance now. We wrapped the query in
performance.now(). Notice that even when performing aggregations on thousands
of rows, the query time stays incredibly low.
Finally, we use ::DOUBLE and ::STRING within the SQL to ensure the data
types are exactly what the frontend expects, avoiding manual parsing later in
the JavaScript.
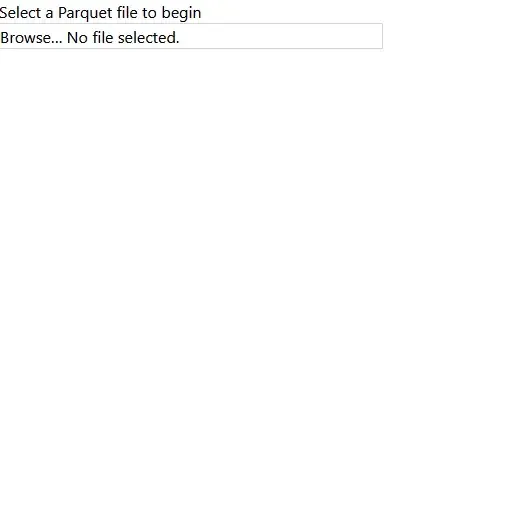
Branch 2: Bring-Your-Own-Data (Local Files)
One of the most powerful features of DuckDB-Wasm is its ability to process local files. In this branch, we allow users to drop their own Parquet files into the browser for immediate analysis. Because the processing happens entirely on the user’s machine, the data never touches a server. This method is both private and fast.
<script>
	import { onMount } from 'svelte';
	import * as duckdb from '@duckdb/duckdb-wasm';
	import duckdb_worker from '@duckdb/duckdb-wasm/dist/duckdb-browser-mvp.worker.js?worker';
	import duckdb_wasm from '@duckdb/duckdb-wasm/dist/duckdb-mvp.wasm?url';

	/** @type {duckdb.AsyncDuckDB | null} */
	let db = null;

	/** @type {duckdb.AsyncDuckDBConnection | null} */
	let conn = null;

	/** @type {File | null} */
	let file = $state(null);

	/** @type {string | null} */
	let fileName = $state(null);

	/** @type {Array<Object.<string, any>>} */
	let rows = $state([]);

	/**
	 * @typedef {Object} SchemaRow
	 * @property {string} column_name
	 * @property {string} column_type
	 * @property {string} [null]
	 * @property {string} [key]
	 * @property {any} [default]
	 * @property {any} [extra]
	 */

	/** @type {SchemaRow[]} */
	let schema = $state([]);

	/**
	 * @typedef {Object} StatsRow
	 * @property {string} column_name
	 * @property {string} column_type
	 * @property {any} min
	 * @property {any} max
	 * @property {number | string | null} avg
	 * @property {number} null_percentage
	 */

	/** @type {StatsRow[]} */
	let stats = $state([]);

	let loading = $state(true);
	let processing = $state(false);

	/** @type {null | string} */
	let error = $state(null);

	let queryTime = $state(0);

	async function initDB() {
		try {
			const worker = new duckdb_worker();
			const logger = new duckdb.ConsoleLogger();
			db = new duckdb.AsyncDuckDB(logger, worker);

			await db.instantiate(duckdb_wasm);

			conn = await db.connect();
		} catch (e) {
			console.error(e);
			error = String(e);
		} finally {
			loading = false;
		}
	}

	/** @param {Event} e */
	async function handleFile(e) {
		const target = /** @type {HTMLInputElement} */ (e.target);
		if (!target.files || target.files.length === 0) return;

		file = target.files[0];
		fileName = file.name;
		processing = true;
		error = null;

		try {
			if (!db || !conn) throw new Error('Database not initialized.');

			await db.registerFileHandle(
				'user_data.parquet',
				file,
				duckdb.DuckDBDataProtocol.BROWSER_FILEREADER,
				true
			);

			const start = performance.now();

			const schemaResult = await conn.query(`DESCRIBE SELECT * FROM 'user_data.parquet';`);
			schema = schemaResult.toArray().map((r) => r.toJSON());

			const selectColumns = schema
				.map((col) => {
					if (col.column_type.includes('BIGINT') || col.column_type.includes('HUGEINT')) {
						return `"${col.column_name}"::DOUBLE AS "${col.column_name}"`;
					}

					return `"${col.column_name}"`;
				})
				.join(', ');

			const result = await conn.query(`SELECT ${selectColumns} FROM 'user_data.parquet' LIMIT 20;`);
			rows = result.toArray().map((r) => r.toJSON());

			const statsResult = await conn.query(`SUMMARIZE SELECT * FROM 'user_data.parquet';`);
			stats = statsResult.toArray().map((r) => r.toJSON());

			queryTime = performance.now() - start;
		} catch (e) {
			console.error(e);
			error = String(e);
		} finally {
			processing = false;
		}
	}

	onMount(() => {
		initDB();
	});
</script>

{#if loading}
	<p>Initializing DuckDB engine...</p>
{:else if !file}
	<div class="flex flex-col">
		<label for="file">Select a Parquet file to begin</label>
		<input
			id="file"
			type="file"
			accept=".parquet"
			onchange={handleFile}
			class="max-w-sm border border-gray-300"
		/>
	</div>
{:else if error}
	<p class="text-red-600">{error}</p>
{:else}
	<button
		class="border border-gray-300 p-2"
		onclick={() => {
			file = null;
			rows = [];
			stats = [];
		}}
	>
		Reset
	</button>

	{#if processing}
		<p>Processing...</p>
	{:else}
		<p>Processed in {queryTime.toFixed(0)}ms</p>

		<table>
			<thead>
				<tr>
					<th class="p-2 text-left">Column</th>
					<th class="p-2 text-left">Type</th>
					<th class="p-2 text-left">Null %</th>
					<th class="p-2 text-left">Min</th>
					<th class="p-2 text-left">Max</th>
					<th class="p-2 text-left">Avg</th>
				</tr>
			</thead>
			<tbody>
				{#each stats as stat}
					<tr class="border-b border-gray-300">
						<td class="p-2">{stat.column_name}</td>
						<td class="p-2">{stat.column_type}</td>
						<td class="p-2">{stat.null_percentage}%</td>
						<td class="p-2">{stat.min ?? '-'}</td>
						<td class="p-2">{stat.max ?? '-'}</td>
						<td class="p-2">
							{#if typeof stat.avg === 'number'}
								{stat.avg.toFixed(2)}
							{:else}
								-
							{/if}
						</td>
					</tr>
				{/each}
			</tbody>
		</table>

		<table>
			<thead>
				<tr>
					{#each schema as col}
						<th class="p-2 text-left">{col.column_name}</th>
					{/each}
				</tr>
			</thead>
			<tbody>
				{#each rows as row}
					<tr class="border-b border-gray-300">
						{#each schema as col}
							<td class="p-2">{row[col.column_name]}</td>
						{/each}
					</tr>
				{/each}
			</tbody>
		</table>
	{/if}
{/if}
This file is on the byod branch of the repository.
This implementation introduces dynamic schema handling and local file registration.
Instead of a URL, we use registerFileHandle with the BROWSER_FILEREADER
protocol. This puts a standard JavaScript File object from an input field
directly into DuckDB’s virtual filesystem.
Since we don’t know the file’s structure ahead of time, we run DESCRIBE on the
table. This allows us to dynamically build the table headers and identify data
types for every column.
Then we use the SUMMARIZE command, which automatically calculates the minimum,
maximum, average, and null percentage for every column in the dataset with a
single query.
Note that Parquet files can contain 64-bit integers (BIGINT), which JavaScript
can’t represent precisely. We programmatically detect these columns and cast
them to DOUBLE during the query to ensure they display correctly in the UI.
Branch 3: Cross-Filtering with Visualizations
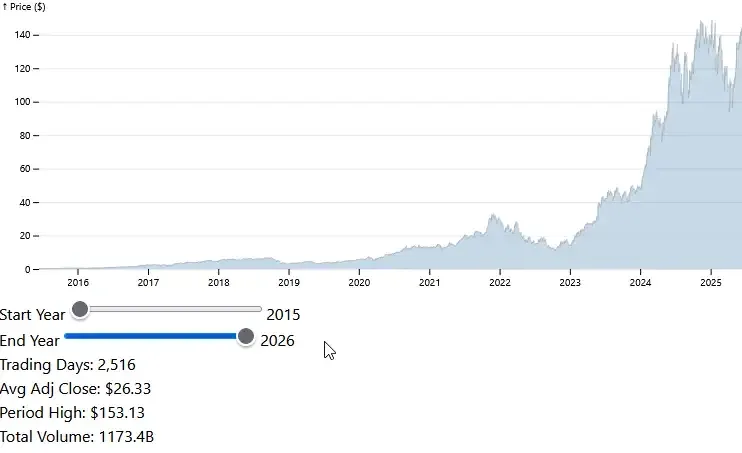
For our final branch, we’re integrating Observable Plot to create an interactive visual analytics experience. This demonstrates the “cross-filtering” pattern: as the user adjusts the date range, the chart highlights the selected period and DuckDB instantly recalculates the summary statistics for that specific window.
<script>
	import { onMount } from 'svelte';
	import * as duckdb from '@duckdb/duckdb-wasm';
	import * as Plot from '@observablehq/plot';
	import duckdb_worker from '@duckdb/duckdb-wasm/dist/duckdb-browser-mvp.worker.js?worker';
	import duckdb_wasm from '@duckdb/duckdb-wasm/dist/duckdb-mvp.wasm?url';

	const DATA_URL = '/train-00000-of-00001.parquet';

	/** @type {duckdb.AsyncDuckDB | null} */
	let db = null;
	/** @type {duckdb.AsyncDuckDBConnection | null} */
	let conn = null;

	let loading = $state(true);

	/** @type {string | null} */
	let error = $state(null);

	/** @type {HTMLElement | undefined} */
	let chartContainer = $state();

	/**
	 * @typedef {Object} ChartRow
	 * @property {string} Date
	 * @property {number} Price
	 */

	/** @type {ChartRow[]} */
	let chartData = $state([]);

	let summary = $state({ count: 0, avgPrice: 0, maxHigh: 0, totalVol: 0 });

	let startYear = $state(2015);
	let endYear = $state(2026);

	async function initDB() {
		try {
			const worker = new duckdb_worker();
			db = new duckdb.AsyncDuckDB(new duckdb.ConsoleLogger(), worker);
			await db.instantiate(duckdb_wasm);
			await db.registerFileURL('nvda.parquet', DATA_URL, duckdb.DuckDBDataProtocol.HTTP, false);
			conn = await db.connect();

			const result = await conn.query(`
				SELECT Date::STRING as Date, "Adj Close"::DOUBLE as Price
				FROM 'nvda.parquet'
				ORDER BY Date ASC
			`);
			chartData = result.toArray().map((r) => r.toJSON());

			await updateSummary();
		} catch (e) {
			error = String(e);
		} finally {
			loading = false;
		}
	}

	async function updateSummary() {
		if (!conn) return;

		const result = await conn.query(`
			SELECT
				count(*)::DOUBLE as count,
				avg("Adj Close")::DOUBLE as avgPrice,
				max(High)::DOUBLE as maxHigh,
				sum(Volume)::DOUBLE as totalVol
			FROM 'nvda.parquet'
			WHERE year(Date) >= ${startYear} AND year(Date) <= ${endYear}
		`);

		const data = result.toArray().map((r) => r.toJSON())[0];
		summary = data;
	}

	$effect(() => {
		const years = { startYear, endYear };
		if (conn) updateSummary();
	});

	$effect(() => {
		if (chartContainer && chartData.length > 0) {
			const chart = Plot.plot({
				width: chartContainer.clientWidth,
				height: 300,
				y: { grid: true, label: 'Price ($)' },
				x: { type: 'utc', ticks: 10 },
				marks: [
					// Outline
					Plot.lineY(chartData, { x: 'Date', y: 'Price', stroke: '#ccc', strokeWidth: 1 }),

					// Fill
					Plot.areaY(chartData, {
						filter: (d) => {
							const y = new Date(d.Date).getFullYear();
							return y >= startYear && y <= endYear;
						},
						x: 'Date',
						y: 'Price',
						fill: 'steelblue',
						fillOpacity: 0.3
					})
				]
			});
			chartContainer.replaceChildren(chart);
		}
	});

	onMount(() => {
		initDB();
	});
</script>

{#if loading}
	<p>Initializing DuckDB engine...</p>
{:else if error}
	<p class="text-red-500">{error}</p>
{:else}
	<div bind:this={chartContainer}></div>

	<div>
		<label for="startYear">Start Year</label>
		<input id="startYear" type="range" min="2015" max={endYear} bind:value={startYear} />
		<span>{startYear}</span>
	</div>
	<div>
		<label for="endYear">End Year</label>
		<input id="endYear" type="range" min={startYear} max="2026" bind:value={endYear} />
		<span>{endYear}</span>
	</div>

	<div>Trading Days: {summary.count.toLocaleString()}</div>
	<div>Avg Adj Close: ${summary.avgPrice.toFixed(2)}</div>
	<div>Period High: ${summary.maxHigh.toFixed(2)}</div>
	<div>Total Volume: {(summary.totalVol / 1000000000).toFixed(1)}B</div>
{/if}
This file is on the cross-filtering-charts branch of the repository.
This setup combines high-performance querying with reactive rendering.
Instead of pulling all filtered rows into JavaScript and calculating averages
manually, we let DuckDB do it. The updateSummary function runs a SQL query
using AVG, MAX, and SUM, returning only a single row of results to the
frontend.
We use a Svelte bind:this on a <div> and an $effect to re-render the chart
whenever chartData or the year bounds change. The
chartContainer.replaceChildren(chart) pattern is a clean way to handle DOM
updates between Svelte and an external charting library.
In the chart, we draw a light gray outline of the entire dataset, then fill in
the area blue. This fill uses a filter based on our startYear and endYear
state, providing immediate visual feedback as you scrub through the timeline.
Notice how the chart data is loaded once, but the summary stats are re-queried on every slider move. This keeps the interaction snappy while ensuring the displayed metrics are always perfectly accurate to the filtered range.
Performance Considerations
DuckDB-Wasm isn’t small. The WASM binary and worker code are several megabytes that must be loaded in the user’s browser. It is not the right tool for a lightweight pages. But the performance gains outweigh the bundle size for data-heavy applications and analytical dashboards.
There is also an initialization cost. The browser must download the engine and the initial Parquet file before any queries can be ran. Browser caching can mitigates this, but you should design your UI to handle a few seconds of loading time during the initial startup.
Finally, remember that you are running a database in RAM. Parquet is pretty memory-efficient, but you’re still constrained by the browser’s memory limits. Large amounts of data can easily crash a mobile browser.
Frontend Data Warehouse Power
The ability to move the database into the browser changes your options when building data-driven applications. You can leverage DuckDB-Wasm and Parquet to replace slow API round-trips with instant, serverless analytics. This stack brings real data warehouse power directly to the frontend. It might just be perfect for your next interactive dashboard or local-first tool.
Cover photo by Rohit Choudhari on Unsplash.