 Travis Horn
Managing Geographic Zones with GeoJSON and MariaDB
One of the most common yet complex challenges in application development is the “zone lookup” problem. It’s used in processes like managing school district boundaries, defining exclusive sales territories for a CRM, and determining shipping costs based on delivery regions. In any case, you have a specific location (an address), and you need to know exactly which organizational “bucket” it falls into.
In an ideal world, this geographic data would be handed to you in a clean, query-ready format. However, in the real world, the starting point is often much messier. You might be staring at a PDF map on a manager’s desktop, a JPEG image on a legacy website, or even a physical map pinned to an office wall. You have the visual representation of the boundaries, but you lack the actual coordinate data required for a computer to make a decision. You cannot run a SQL query against a JPEG.
Let’s bridge the gap between a visual map and a functional database. We are going to build a system where a user can enter an address, and the application instantly returns the correct zone.
To achieve this, we will move through a complete spatial data pipeline:
- Creating raw data from visual maps using GeoJSON.
- Automating the transformation of that data using Python.
- Leveraging MariaDB’s native spatial features to store the boundaries.
- Writing the SQL logic to determine where a point exists within a polygon.
Let’s get started by turning those imaginary lines into real data.
Creating the Spatial Data
Since our starting point is a visual map (like a PDF or an image), we cannot simply “import” the boundaries. We have to digitize them. This is often the most labor-intensive part of the process, but getting high-quality coordinate data is essential for accurate queries later.
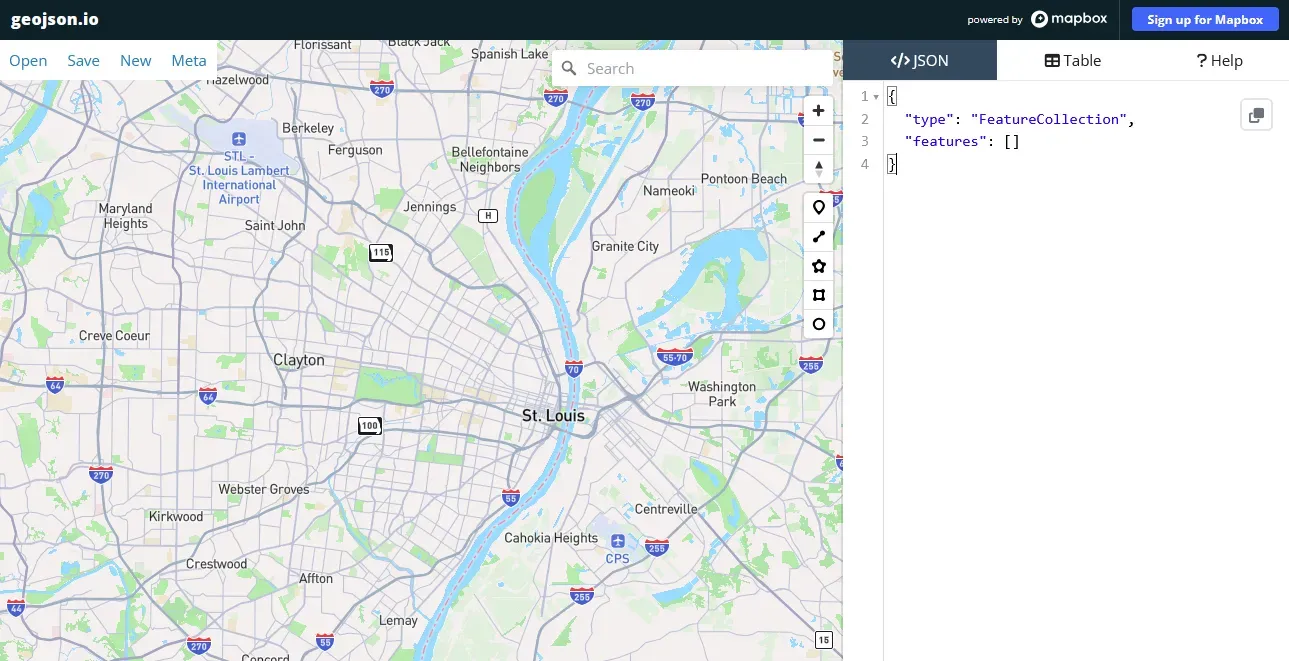
To bridge the gap between the image on our screen and the code in our editor, we will use the free tools available on GeoJSON.io. This is a fast, simple, open-source editor for map data.
The Process
- Open GeoJSON.io in your browser. You will see a map on
the left and a JSON code editor on the right.
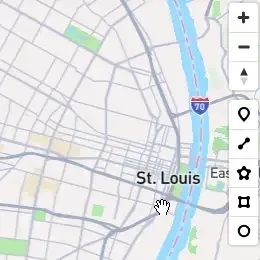
- Zoom into the geographic area where your zones are located (e.g., a specific city or neighborhood).
- Draw the Zones:
- Select the Draw Polygon tool from the toolbar on the right (it looks like a small pentagon).
- Looking at your reference map (the PDF or image), click points on the map to trace the outline of your first zone.
- To finish the shape, you must click back on the very first point you
placed to “close the loop.”
- A shape without a name isn’t very useful in a database. We need to label it.
In the code editor on the right side of the site, look for the
propertieskey. Add a new property calledname. For the value, enter the name of the zone (e.g., “North District” or “Zone A”).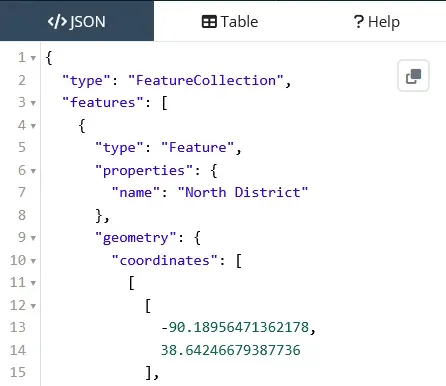
- Continue this process for every zone on your map. As you draw, you will see the JSON on the right side of the screen automatically populate with coordinates.
Once you have defined all your zones, click the Copy button in the editor
pane. Paste this data into your code editor and save it as a file named
zones-geo.json.
You now have a structured FeatureCollection, which is a machine-readable text
file representing the physical shapes of your zones. In the next step, we’ll
prepare the database to receive it.
Preparing the Database (MariaDB)
Now that we have our raw data saved as a file, we need a place to store it. While you could technically query the JSON file directly in some environments, that is not scalable. To get the performance we need for real-time lookups, we need to load this data into a relational database with spatial capabilities.
MariaDB is an excellent choice for this because it has native support for the Open Geospatial Consortium (OGC) standard. This means it can understand concepts like “points,” “lines,” and “polygons” not just as text, but as geometric shapes.
Schema Creation
We need to create a table that holds the zone metadata (the name) and the zone geometry (the shape).
There is one crucial detail here: we will use the MULTIPOLYGON data type
rather than POLYGON. Even if your current zones are simple shapes, using
MULTIPOLYGON ensures your database can handle complex edge cases later such as
a single zone that consists of two disconnected areas (like a district that
includes an island).
We also need to add a SPATIAL KEY. This creates a specialized index (often an
R-tree) that allows the database to perform geometric calculations efficiently.
Without it, the database would have to scan every single row and calculate
complex math for every lookup, which would be incredibly slow.
Run the following SQL command to set up your table:
CREATE TABLE zones (
  id int(11) NOT NULL AUTO_INCREMENT,
  name varchar(255) NOT NULL,
  boundary multipolygon NOT NULL,
  PRIMARY KEY (`id`),
  SPATIAL KEY boundary (`boundary`)
);
With the zones table ready, we now have a container waiting for our data. In
the next step, we will write the automation script to fill it.
Inserting the Data
Having the GeoJSON file is great because it is a portable standard used by many
applications. However, for our specific purpose, we need to transform that JSON
structure into a bulk SQL INSERT statement that MariaDB can execute.
To do this, we will use a Python script. This script will act as a bridge, performing several critical tasks:
- It reads the
zones-geo.jsonfile. - It normalizes the data. MariaDB is strict about data types. Since we defined
our database column as
MULTIPOLYGON, we cannot simply insert a standardPOLYGONgeometry. The script detects simple polygons and wraps them in an extra array bracket to convert them intoMultiPolygons, ensuring they fit our schema. - It escapes special characters (like apostrophes in names) to prevent SQL syntax errors.
- Finally, It outputs a clean file named
zones_insert.sql.
Here is the script to automate this conversion:
import json
import os

# Configuration
INPUT_FILE = 'zones-geo.json'
OUTPUT_FILE = 'zones_insert.sql'

def generate_sql_file():
  if not os.path.exists(INPUT_FILE):
    print(f"Error: {INPUT_FILE} not found.")
    return

  try:
    with open(INPUT_FILE, 'r', encoding='utf-8') as f:
      data = json.load(f)
  except json.JSONDecodeError as e:
    print(f"Error parsing JSON: {e}")
    return

  if data.get('type') != 'FeatureCollection' or 'features' not in data:
    print("Error: Input file is not a valid GeoJSON FeatureCollection.")
    return

  features = data['features']
  values_parts = []
  print(f"Processing {len(features)} features...")

  for feature in features:
    # 1. Extract Name
    properties = feature.get('properties', {})
    name = properties.get('name', 'Unknown')
    safe_name = name.replace("'", "''")

    # 2. Extract and Normalize Geometry
    geometry = feature.get('geometry')

    if not geometry:
      continue

    geom_type = geometry.get('type')
    coordinates = geometry.get('coordinates')

    # The database expects MultiPolygon. If we have a Polygon,
    # we modify the structure in Python to be a MultiPolygon.
    if geom_type == 'Polygon':
      geometry['type'] = 'MultiPolygon'
      # Polygon coords are [ [ring1], [ring2] ]
      # MultiPolygon coords are [ [ [ring1], [ring2] ] ]
            # Convert by wrapping the polygon array in another array
      geometry['coordinates'] = [coordinates]
    elif geom_type != 'MultiPolygon':
      # If it's a Point, LineString, etc., we can't insert it into a MultiPolygon column
      print(f"Skipping feature '{name}': Geometry type is {geom_type}, expected Polygon or MultiPolygon.")
      continue

    # 3. Create JSON string
    geometry_json_str = json.dumps(geometry)

    # 4. Construct SQL Value
    value_line = f"('{safe_name}', ST_GeomFromGeoJSON('{geometry_json_str}'))"
    values_parts.append(value_line)

  if not values_parts:
    print("No valid features found to insert.")
    return

  # 5. Write SQL
  header = "INSERT INTO zones (`name`, boundary) VALUES\n"
  body = ",\n".join(values_parts)
  footer = ";"

  with open(OUTPUT_FILE, 'w', encoding='utf-8') as f:
    f.write(header + body + footer)

  print(f"Success! Generated {len(values_parts)} records in: {OUTPUT_FILE}")

if name == "__main__":
  generate_sql_file()
Once you run this script using Python, it will generate a file called
zones_insert.sql in the same directory. Open your database management tool
(like DBeaver, HeidiSQL, or the command line) and execute the INSERT statement
contained in that file. Your spatial data is now live in the database.
Querying the Data
Now that our database is populated, we can finally begin to query the data and ask the question: “Which zone does this location belong to?”
To answer this, we use the MariaDB spatial function ST_Contains. This function
takes two geometries. In our case, those are…
- the zone boundary (the polygon), and
- a specific location (the point)
It returns true (1) if the second geometry is strictly inside the first.
The “Gotcha”: Coordinate Ordering
Before we look at the query, we have to address a common cause of frustration in spatial programming: coordinate order.
If you copy coordinates from Google Maps or look at a GPS device, you are used to seeing Latitude, Longitude.
For example, St. Louis, MO is located around 38.6270, -90.1994.
However, in geometry, we work on an X/Y plane.
- Longitude is the X-axis (East/West).
- Latitude is the Y-axis (North/South).
Because MariaDB follows the Open Geospatial Consortium (OGC) standards, it
expects coordinates in (X Y) order. This means you must reverse what you are
used to. You must provide Longitude first, then Latitude.
If you get this backwards, your point will likely end up in Antarctica or the middle of the ocean, and your query will return zero results.
The SQL Query
Here is the SQL to find the zone containing a specific coordinate. Note the
order of the numbers in the POINT function:
SELECT
  z.name
FROM zones z
WHERE
  ST_Contains(z.boundary, ST_GeomFromText('POINT(-90.19364 38.62273)', 4326));
Here’s what the query is doing:
z.boundaryis theMultiPolygoncolumn we created earlier.ST_GeomFromText(...)converts a text string into a geometric object the database understands.POINT(-90.19364 38.62273)is our target location. Note again that longitude (-90…) comes before latitude (38…).4326is the Spatial Reference System Identifier (SRID) for standard GPS coordinates (WGS 84).
If you run this query, MariaDB will return the name of the zone that contains that specific point.
Building the Full User Experience
We now have a working spatial database, but we still face a significant User Experience (UX) barrier: Users don’t know their coordinates.
You cannot expect users to type in -90.19364 38.62273. Users think in terms of
addresses, intersections, and landmarks. To make this application usable, we
need a piece of infrastructure to translate human language into database
language.
The Missing Link: Geocoding
This translation process is called geocoding. It turns a text string ("123 Main Street") into a coordinate pair.
While you could build your own geocoder, it is a massive undertaking. In a production environment, you should use an established API such as the Google Maps Platform, Mapbox, or the open-source Nominatim (OpenStreetMap).
The Application Flow
Wiring the full code is beyond the scope of this article, but the architecture for the final application looks like this:
- The frontend provides a simple text input box asking for an address.
- When the user hits Search your backend sends that address string to your chosen geocoding API.
- The API responds with a JSON object containing the latitude and longitude
(e.g.,
lat: 38.622,lng: -90.193). - Your backend takes those coordinates and injects them into the SQL query we
wrote earlier:
Remember to check the order! Some APIs return
lat, lng, but you must passlng, latto MariaDB. - MariaDB runs
ST_Containsand returns the matching zone name (e.g.,"North District"). - The frontend displays the result to the user, perhaps even plotting a pin representing the address and a polygon representing the zone on a map overlay to confirm the location.
By chaining these tools together, you create an experience where a messy visual map becomes an instant, accurate answer for your users.
Bonus: Handling Overlapping Zones (Layers)
In the examples above, we assumed a “flat” map where zones never touch or overlap. But in the real world, geography is often layered.
For example, a single address might simultaneously belong to:
- School District:
"Central High" - Trash Pickup Day:
"Tuesday" - Sales Territory:
"Midwest Region"
If you strictly assume one result per query, you might miss critical data. Fortunately, the relational nature of MariaDB makes handling layers straightforward.
The “Layers” Approach
The ST_Contains function does not stop at the first match (unless you
explicitly use LIMIT 1). If a point exists inside five overlapping polygons,
the query will return five rows.
To manage this effectively, you can add a category or layer column to your table:
ALTER TABLE zones ADD COLUMN category VARCHAR(50);Now, when you import your data, you can tag the "North District" as a
sales_territory and the "Tuesday Route" as trash_pickup.
Querying Specific Layers
With this structure, you can either query for everything happening at a location, or filter for a specific type of zone:
-- Find strictly the Trash Pickup Zone for this user
SELECT
  z.name
FROM zones z
WHERE
  z.category = 'trash_pickup'
  AND ST_Contains(z.boundary, ST_GeomFromText('POINT(-90.19364 38.62273)', 4326));
By adding this simple column, you transform a simple lookup tool into a multi-dimensional GIS system capable of answering complex business questions.
Turning Maps into Logic
We have traveled a long way from a static PDF map pinned to an office wall. We have now transformed a purely visual resource into a high-performance data asset.
Let’s recap the journey:
- We used GeoJSON.io to digitize abstract boundaries into coordinate data.
- We used Python to normalize that data and prepare it for storage.
- We leveraged MariaDB’s native spatial columns to index the shapes efficiently.
- We combined SQL and Geocoding to answer user questions in real-time.
The beauty of this approach is the simplicity and scalability. You don’t need expensive, proprietary GIS software or a massive dedicated server to handle these types of lookups. Modern relational databases like MariaDB have matured to the point where spatial data is just another data type, living happily alongside your user accounts, orders, and inventory.
You have now bridged the gap between the physical world and your digital infrastructure. The next time someone asks, “Do we deliver to this address?”, you can be confident in your data-driven answer.
Cover photo by Annie Spratt on Unsplash.