 Travis Horn
Modeling a Multi-Currency Settlement Engine

When anyone makes a purchase, whether it’s online or in a brick-and-mortar store, the cardholder’s bank (the issuer) and the merchant’s bank (acquirer) must rely on a system that bridges their data. Every transaction is a complex series of events that requires a settlement process. Often, the transaction involves moving funds across borders and currencies.
If you are responsible for maintaining the settlement system, how do you answer questions like, “What is our net settlement position at the end of the day?”, “Which acquirers are driving volume growth?”, or “Are cross-border interchange fees being calculated correctly?”
Let’s take a look at a multi-currency settlement engine concept. We’ll walk through the architecture of a relational database schema, implement a Python-based data generator to simulate realistic transaction traffic, and write some complex SQL logic that you might see when analyzing data like this.
Database Schema
In a production system, the SQL engine would most likely be an enterprise-grade database like PostgreSQL, Microsoft SQL Server, or Oracle Database. However, for this simplified example, I’m using SQLite. This helps us get up and running faster and makes the demonstration easier to follow.
First, we need to set up our database schema. The first entity we’ll define is the issuer. These are the banks that issue cards. We’ll use ISO currency codes and standard 3-letter country codes to support cross-border settlements.
CREATE TABLE issuers (
  issuer_id INTEGER PRIMARY KEY AUTOINCREMENT,
  institution_name TEXT NOT NULL,
  country_code TEXT NOT NULL,
  base_currency TEXT NOT NULL
);
The country_codes will be something like USA or GBR, while the
base_currency will be something like USD or GBP. These would be better as
references to values in separate tables in a real production system. But let’s
keep it simple for demonstration purposes.
Next, we’ll define the acquirer. These are the banks that process payments for merchants.
CREATE TABLE acquirers (
  acquirer_id INTEGER PRIMARY KEY AUTOINCREMENT,
  institution_name TEXT NOT NULL,
  country_code TEXT NOT NULL,
  base_currency TEXT NOT NULL
);
Note that you could total normalize this further by creating a separate table
for banks, and then referencing them from both the issuers and acquirers
tables. But for this example, we’ll keep it simple.
Since banks can operate as issuers and/or acquirers, we could normalize the
schema with a separate banks table with shared data and then reference it from
both issuers and acquirers. But again, for the sake of the demonstration,
we’ll keep it simple.
The core ledger will be held in a table called transactions.
CREATE TABLE transactions (
  transaction_id INTEGER PRIMARY KEY AUTOINCREMENT,
  txn_date TEXT NOT NULL,
  amount_local REAL NOT NULL,
  currency_local TEXT NOT NULL,
  issuer_id INTEGER,
  acquirer_id INTEGER,
  status TEXT CHECK(status IN ('CLEARED', 'SETTLED', 'DECLINED', 'DISPUTED')),
  FOREIGN KEY(issuer_id) REFERENCES issuers(issuer_id),
  FOREIGN KEY(acquirer_id) REFERENCES acquirers(acquirer_id)
);
I made txn_date have the TEXT data type to make it easier to read out of
SQLite. This way we can insert and select dates in YYYY-MM-DD format.
Notice how we’re being explicit about the locality of the amount and currency of the transaction. Developers should have no doubt about what currency the amount is in.
Finally, we’ll need a table to hold the interchange fees. This is the cost of doing business. Fees are complex and there may be multiple fees per transaction, so we need this separate table which links fees to transactions.
CREATE TABLE interchange_fees (
fee_id INTEGER PRIMARY KEY AUTOINCREMENT,
transaction_id INTEGER,
fee_amount REAL NOT NULL,
payer_entity TEXT CHECK(payer_entity IN ('ISSUER', 'ACQUIRER')),
FOREIGN KEY(transaction_id) REFERENCES transactions(transaction_id)
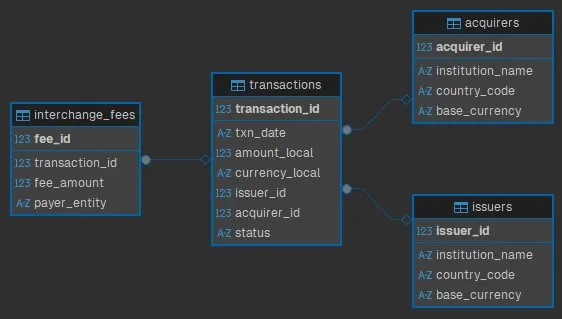
);For a visual representation of the schema, here’s an Entity Relationship Diagram (ERD):
Seeding the Database
The database is ready for data. I wrote a simple Python script to generate and insert fake seed data.
I’m using the Faker library, which you can install via pip:
pip install FakerAt the top, we import the necessary libraries and set up some configuration options.
import sqlite3
import random
from datetime import datetime, timedelta
from faker import Faker

fake = Faker()

DB_NAME = "local.db"
NUM_ISSUERS = 8
NUM_ACQUIRERS = 6
DAYS_OF_HISTORY = 30
AVG_TXNS_PER_DAY = 150

CURRENCIES = ["USD", "GBP", "EUR", "CAD"]
COUNTRIES = {"USD": "USA", "GBP": "GBR", "EUR": "FRA", "CAD": "CAN"}
Next, we create a function to generate participants (issuers and acquirers).
def generate_participants(cursor):
    issuer_ids = []
    acquirer_ids = []

    for _ in range(NUM_ISSUERS):
        currency = random.choice(CURRENCIES)
        country = COUNTRIES[currency]
        name = f"{fake.company()} Bank"

        cursor.execute(
            "INSERT INTO issuers (institution_name, country_code, base_currency) VALUES (?, ?, ?)",
            (name, country, currency)
        )
        issuer_ids.append(cursor.lastrowid)

    for _ in range(NUM_ACQUIRERS):
        currency = random.choice(CURRENCIES)
        country = COUNTRIES[currency]
        name = f"{fake.company()} Merchant Services"

        cursor.execute(
            "INSERT INTO acquirers (institution_name, country_code, base_currency) VALUES (?, ?, ?)",
            (name, country, currency)
        )
        acquirer_ids.append(cursor.lastrowid)

    return issuer_ids, acquirer_ids
This function accepts a database cursor, which we’ll pass to it later.
It loops to create institutions with Faker and inserts them into the
appropriate table.
It returns two lists of IDs: one for issuers and one for acquirers.
Next, we create a function to generate traffic.
def generate_traffic(cursor, issuer_ids, acquirer_ids):
    end_date = datetime.now()
    start_date = end_date - timedelta(days=DAYS_OF_HISTORY)

    total_txns = 0

    for day in range(DAYS_OF_HISTORY + 1):
        current_date = (start_date + timedelta(days=day)).strftime('%Y-%m-%d')

        # Randomize volume per day
        daily_vol = random.randint(int(AVG_TXNS_PER_DAY * 0.8), int(AVG_TXNS_PER_DAY * 1.2))

        for _ in range(daily_vol):
            issuer = random.choice(issuer_ids)
            acquirer = random.choice(acquirer_ids)

            # Give the statuses some weight. Most are settled.
            status = random.choices(
                ['SETTLED', 'CLEARED', 'DECLINED', 'DISPUTED'],
                weights=[85, 10, 4, 1], k=1
            )[0]

            # Amounts between 5.00 and 500.00
            amount = round(random.uniform(5.00, 500.00), 2)
            currency = random.choice(CURRENCIES)

            cursor.execute('''
                INSERT INTO transactions
                (txn_date, amount_local, currency_local, issuer_id, acquirer_id, status)
                VALUES (?, ?, ?, ?, ?, ?)
            ''', (current_date, amount, currency, issuer, acquirer, status))

            txn_id = cursor.lastrowid

            # Generate Fees for Settled transactions
            if status == 'SETTLED':
                # Fee = base fee + cross border fee if currencies don't match
                # Using 1.5% interchange fee
                fee_val = round(amount * 0.015, 2)
                if fee_val < 0.05: fee_val = 0.05 # Minimum fee

                cursor.execute('''
                    INSERT INTO interchange_fees (transaction_id, fee_amount, payer_entity)
                    VALUES (?, ?, ?)
                ''', (txn_id, fee_val, "ACQUIRER"))

            total_txns += 1
This function accepts a database cursor, along with the lists of issuer and acquirer IDs. It loops to create transactions over a date range, randomizing statuses and amounts.
If the status is SETTLED, it also generates an interchange fee, as well.
Finally, we put it all together in the main function.
def main():
    conn = sqlite3.connect(DB_NAME)
    cursor = conn.cursor()

    try:
        issuers, acquirers = generate_participants(cursor)

        generate_traffic(cursor, issuers, acquirers)

        conn.commit()

    except Exception as e:
        print(f"An error occurred: {e}")
        conn.rollback()
    finally:
        conn.close()

if __name__ == "__main__":
    main()
When you run this script…
python seed.py…it populates local.db with the fake data.
User Stories and Acceptance Criteria
With our database populated, the next step is to define exactly what insights we need to extract. One great method to do this is by using user stories and acceptance criteria. These can be used as blueprints to make sure the SQL we write answers the specific questions people are asking.
Here’s an example of a user story you might see that involves the settlement engine we just built:
As a Product Strategist, I want to see the day-over-day growth percentage of transaction volue per acquirer, so that I can identify which institutions are driving platform growth and offer them incentives.
Now let’s look at some acceptance criteria for this user story:
- Verify calculation of Daily Volume = Sum of
amount_localwherestatus='SETTLED'. - Verify the report ranks acquirers by total volume per day (rank 1 is the highest).
- Verify the report calculates the percentage difference between the current day and previous day’s volume.
Query Implementation
Let’s satisfy the acceptance criteria; specifically the need to compare today’s
volume against yesterday’s. A simple GROUP BY statement can give us daily
totals, but it cannot easily reference previous rows to calculate growth rates.
To solve this, we will use Common Table Expressions (CTEs) to structure the data
and Window Functions (specifically LAG and RANK) to analyze performance trends
over time.
WITH DailyVolumes AS (
  -- Aggregate transaction data by acquirer and date
  SELECT
    t.acquirer_id,
    a.institution_name,
    t.txn_date,
    SUM(t.amount_local) AS total_daily_volume,
    COUNT(t.transaction_id) AS txn_count
  FROM transactions t
  JOIN acquirers a ON t.acquirer_id = a.acquirer_id
  WHERE
    t.status = 'SETTLED'
  GROUP BY
    t.acquirer_id,
    t.txn_date
),
GrowthAnalysis AS (
  -- Compare against previous day and Rank
  SELECT
    acquirer_id,
    institution_name,
    txn_date,
    total_daily_volume,
    -- Lag. Get the volume from the previous record for this specific acquirer
    LAG(total_daily_volume, 1, 0) OVER (
      PARTITION BY acquirer_id
      ORDER BY txn_date
    ) AS previous_day_volume,
    -- Rank acquirers by volume for each specific day
    RANK() OVER (
      PARTITION BY txn_date
      ORDER BY total_daily_volume DESC
    ) AS daily_rank
  FROM DailyVolumes
)
SELECT
  institution_name,
  txn_date,
  total_daily_volume,
  previous_day_volume,
  daily_rank,
  -- Day-over-day growth
  CASE
    WHEN previous_day_volume = 0 THEN 0
    ELSE ROUND(((total_daily_volume - previous_day_volume) / previous_day_volume) * 100, 2)
  END AS growth_percentage
FROM GrowthAnalysis
ORDER BY
  txn_date DESC,
  daily_rank ASC;
The first thing we do is create a couple Common Table Expressions (CTEs). These have the benefit of breaking the logic down into more digestible pieces.
The DailyVolumes CTE aggregates the transaction data by acquirer and date,
summing up the total daily volume and counting the number of transactions. By
itself, the output of the CTE would look like this excerpt:
| acquirer_id | institution_name | txn_date | total_daily_volume | txn_count |
|---|---|---|---|---|
| 13 | Brown Merchant Services | 2025-12-21 | 5433.19 | 20 |
| 13 | Brown Merchant Services | 2025-12-22 | 5491.70 | 20 |
| 13 | Brown Merchant Services | 2025-12-23 | 3690.51 | 14 |
| 13 | Brown Merchant Services | 2025-12-24 | 4585.20 | 23 |
| 13 | Brown Merchant Services | 2025-12-25 | 4782.82 | 20 |
The second CTE, GrowthAnalysis, builds on the first by calculating the
previous day’s volume using the LAG() window function. It also ranks acquirers
by the daily volume using the RANK() window function. The output of this CTE
would look something like this excerpt:
| acquirer_id | institution_name | txn_date | total_daily_volume | previous_day_volume | daily_rank |
|---|---|---|---|---|---|
| 13 | Brown Merchant Services | 2025-12-21 | 5433.19 | 0 | 4 |
| 13 | Brown Merchant Services | 2025-12-22 | 5491.70 | 5433.19 | 4 |
| 13 | Brown Merchant Services | 2025-12-23 | 3690.51 | 5491.70 | 4 |
| 13 | Brown Merchant Services | 2025-12-24 | 4585.20 | 3690.51 | 3 |
| 13 | Brown Merchant Services | 2025-12-25 | 4782.82 | 4585.20 | 5 |
Finally, in the main query, we select the relevant fields and calculate the day-over-day growth. The end result of the entire query looks like this excerpt:
| institution_name | txn_date | total_daily_volume | previous_day_volume | daily_rank | growth_percentage |
|---|---|---|---|---|---|
| Robinson-Walker Merchant Services | 2026-01-20 | 7907.93 | 3642.64 | 1 | 117.09 |
| Beck-Aguilar Merchant Services | 2026-01-20 | 6535.32 | 3479.21 | 2 | 87.84 |
| Ramirez-Sanchez Merchant Services | 2026-01-20 | 6156.76 | 1890.98 | 3 | 225.59 |
| Perez Group Merchant Services | 2026-01-20 | 5169.90 | 3268.53 | 4 | 58.17 |
| Torres Ltd Merchant Services | 2026-01-20 | 4520.12 | 5237.88 | 5 | -13.7 |
This output gives the user exactly what they requested. We can see the
total_daily_volume for settled transactions, satisfying the first criterion.
The daily_rank column organizes the data so the top performers, like
Robinson-Walker, are immediately visible. Finally, the growth_percentage
column show trends. For example, while Ramirez-Sanchez is ranked third in
volume, their massive 225% growth indicates they are a rapidly expanding partner
where an incentive might be in order.
Data to Decisions
We built a system with a normalized schema to handle multi-currency transactions. We generated test data with Python. And we wrote some complex SQL to uncover growth trends. A real-world production system is far more complex (distributed databases and real-time streaming). But the core principle remains the same. We can extract strategic metrics from raw transaction logs. Ledgers can be used to drive growth.
You can find the complete code for this project on GitHub: Settlement Engine.
Cover photo by Steve Johnson on Unsplash.