 Travis Horn
Svelte Client-Side Rendering for Observable Plot Done Right

Previously, I wrote about rendering Observable Plot server-side with SvelteKit. Today, I’m tackling client-side rendering. While it might seem straightforward, getting the implementation right requires a bit of finesse.
I was initially pleased to find an example in the official Observable Plot
documentation,
but I take issue with it. It uses an $effect block to manually delete a child
element and shove a new one in:
$effect(() => {
    div?.firstChild?.remove(); // remove old chart, if any
    div?.append(Plot.lineY(data).plot({ grid: true })); // add the new chart
});
Going behind Svelte’s back to manually change the DOM is risky. If Svelte later
tries to update or remove that <div>, it might encounter unexpected elements
and crash.
Since Observable Plot requires direct DOM manipulation, how do we do it safely? Svelte Actions are the official escape hatch, explicitly designed for letting you manage the lifecycle and contents of an element yourself.
Here’s an Action you can use. Save this as PlotFigure.ts:
import * as Plot from "@observablehq/plot";

export default function PlotFigure(node: HTMLElement, options: Plot.PlotOptions) {
    let viz: (HTMLElement | SVGSVGElement) & Plot.Plot;

    function render(options: Plot.PlotOptions) {
        viz?.remove();
        viz = Plot.plot(options);
        node.append(viz);
    }

    render(options);

    return {
        update: render,
        destroy() {
            viz?.remove();
        }
    };
}
While similar to the $effect() block from earlier, this method establishes
clean boundaries and hooks.
To use this Action:
<script lang="ts">
import * as Plot from '@observablehq/plot';
import * as d3 from 'd3';
import PlotFigure from '$lib/PlotFigure';
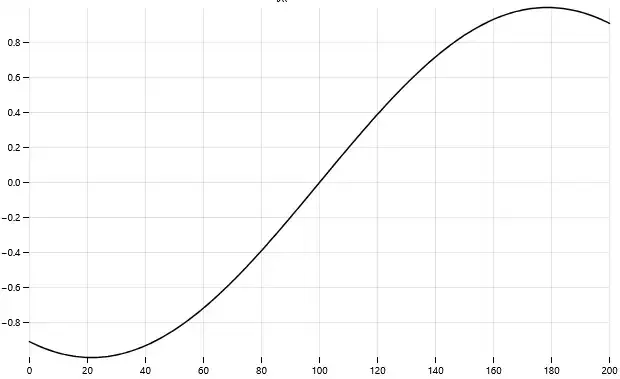
let data = $state(d3.ticks(-2, 2, 200).map(Math.sin));
let options = $derived({
grid: true,
marks: [Plot.lineY(data)]
});
function onMousemove(event: MouseEvent) {
const [x, y] = d3.pointer(event);
data = data.slice(-200).concat(Math.atan2(x, y));
}
</script>
<div use:PlotFigure={options} onmousemove={onMousemove} role="img"></div>Because options is a $derived state, any changes to the underlying data
will automatically trigger the Action to re-render the plot.
Bonus!
Don’t feel like copying and pasting the Svelte Action above? I’ve packaged it and published it on npm.
npm install @travishorn/svplot<script>
import { ObservablePlot } from '@travishorn/svplot';
/* Define data and options here, as usual */
</script>
<div use:ObservablePlot={options} role="img"></div>Cover photo by Hassaan Here on Unsplash.