


Say you have a database that contains information about clients your company serves. Among the client information are two pieces of data: geographical location and number of orders.
You could extend this example to other data points, but the location will be the main focus of this article.
You or your company may find it beneficial to view client data sorted and filtered based on location. Follow along and build a web app that helps you visualize this information.
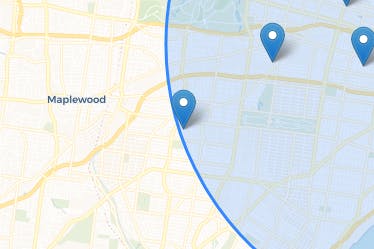
Here’s a preview of what you can build by following this guide:
First, we must transform the raw data into a format usable by our web app. Here is the raw data I’m using in this example:
[
  { id: 0, coords: [38.622185, -90.257458], orders: 52 },
  { id: 1, coords: [38.668842, -90.237202], orders: 56 },
  { id: 2, coords: [38.604211, -90.288014], orders: 93 },
  { id: 3, coords: [38.653293, -90.278744], orders:  6 },
  { id: 4, coords: [38.639886, -90.216259], orders: 53 },
  { id: 5, coords: [38.638813, -90.144848], orders: 24 },
  { id: 6, coords: [38.609577, -90.203900], orders: 73 },
  { id: 7, coords: [38.621112, -90.226216], orders: 83 },
  { id: 8, coords: [38.637204, -90.232052], orders: 16 },
  { id: 9, coords: [38.631949, -90.189882], orders: 16 },
]
Notice each client has an ID number, GPS coordinates, and a number of orders.
Start with some boilerplate HTML. Create index.html with the following contents.
<!doctype html>
<html lang="en">
  <head>
    <title>Interactive Client Data by Distance</title>

    <meta charset="utf-8">
    <meta name="viewport" content="width=device-width, initial-scale=1, shrink-to-fit=no">

    <link rel="stylesheet" href="https://maxcdn.bootstrapcdn.com/bootstrap/4.0.0-beta.2/css/bootstrap.min.css">
    <link rel="stylesheet" href="https://unpkg.com/leaflet@1.2.0/dist/leaflet.css">
    <link rel="stylesheet" href="https://fonts.googleapis.com/css?family=Roboto+Mono">
    <link rel="stylesheet" href="app.css">
  </head>
  <body>
    <div id="app" class="container my-3 my-sm-5">
      <!-- Our app will go here -->
    </div>

    <script src="https://cdnjs.cloudflare.com/ajax/libs/vue/2.3.4/vue.min.js"></script>
    <script src="https://unpkg.com/leaflet@1.2.0/dist/leaflet.js"></script>
    <script src="app.js"></script>
  </body>
</html>
Besides the basic HTML structure, notice we are including…
Bootstrap CSS — for general design
Leaflet CSS — for making the map look pretty
Roboto Mono font — to display our numerical data neatly in a table
app.css — our custom styles (not written, yet)
Vue.js — for the UI
Leaflet.js — for the embedded map
app.js — our custom JavaScript (not written, yet)
Also notice the single <div> in the body. This will be the mounting point for our app.
First, some styles. Create app.css with the following content.
.map { height: 600px; }

th,
td { text-align: right; }

td {
  font-family: 'Roboto Mono', monospace;
  font-size: 16px;
}
We give the (future) map a height, align text in the (future) table to the right, and set the font in the table to a nice monospace font. This is because the contents of the table will be numerical, and a monospace font will make it easier to read the data across rows and columns.
Now create app.js with this Vue app skeleton.
new Vue({
  el: '#app',

  filters: {},

  data: {
    map: null,
    tileLayer: null,
    centerCircle: null,
    center: [38.627222, -90.197778],
    radius: 1000,
    rawClients: [ /* paste the client data from earlier here */ ],
  },

  computed: {},

  watch: {},

  mounted() {
    this.initMap();
  },

  methods: {
    initMap() {},

    toRadians(n) {},

    distance(p1, p2) {},
  },
});
So far, we have 6 data properties and 3 methods. The 6 data properties are…
map — a placeholder property that will represent our map once it is initialized
tileLayer — a placeholder property that will represent the tile layer on the map once it is initalized
centerCircle — a placeholder property that will represent a semi-transparent circle over the map indicating the area we are currently looking at. This circle will be adjustable.
center — a 2-value array with latitude and longitude for the center of our map. This could be your company headquarters, retail location, or shipping facility. For the sake of example, I’m using downtown Saint Louis, MO.
radius — represents the radius of the centerCircle, in meters
rawClients — The client data. This should be a copy & paste of the client data from earlier in this article.
There are also 3 methods. One of them, initMap() is called when the app is mounted. The other two are helper functions that we can build out right now.
toRadians() is a helper function that takes a number and returns it as a radian (the number multiplied by pi and then divided by 180).
toRadians(n) {
  return n * Math.PI / 180;
}
distance() is a helper function that accepts two latitude-longitude coordinates and returns the distance between them. You don’t have to understand this function. Just know that it is using the Haversine formula.
distance(p1, p2) {
  const R = 6371e3; // meters
  const φ1 = this.toRadians(p1[0]);
  const φ2 = this.toRadians(p2[0]);
  const Δφ = this.toRadians(p2[0] - p1[0]);
  const Δλ = this.toRadians(p2[1] - p1[1]);

  const a = Math.sin(Δφ / 2) * Math.sin(Δφ / 2) +
          Math.cos(φ1) * Math.cos(φ2) *
          Math.sin(Δλ / 2) * Math.sin(Δλ / 2);

  const c = 2 * Math.atan2(Math.sqrt(a), Math.sqrt(1 - a));

  return R * c;
},
Before we can initialize the map, we need an element that Leaflet can bind to.
In your HTML, inside <div id="app">, create a new <div>:
<div id="map" class="map"></div>
Now, back in the Vue app, we can begin writing the initMap() method.
initMap() {
this.map = L.map('map').setView(this.center, 12);
this.tileLayer = L.tileLayer('https://cartodb-basemaps-{s}.global.ssl.fastly.net/rastertiles/voyager/{z}/{x}/{y}.png', {
maxZoom: 18,
attribution: '© <a href="http://www.openstreetmap.org/copyright">OpenStreetMap</a>, © <a href="https://carto.com/attribution">CARTO</a>`,
});
this.tileLayer.addTo(this.map);
},
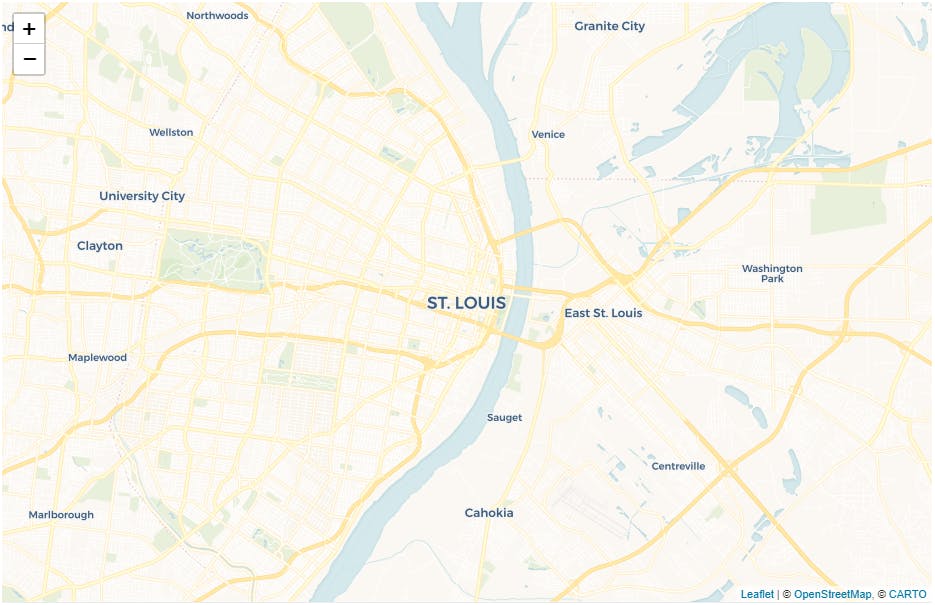
The first line creates a Leaflet map bound to the <div id="map"> element, sets the center of the map to the coordinates we defined earlier, and sets the zoom level to 12.
The second block sets the tile layer (the actual images of streets and rivers, etc.). I’m using Carto’s basemaps. This is a free tile layer provided by Carto. All that’s required of us is to include the appropriate attribution, which I’ve already included in the code above.
The last line adds the tile layer to the map.
If you save your work and load up index.html in your browser, you should see a map of Saint Louis, MO (or wherever you entered as the center of your map).
One very useful piece of information we are going to use in the future is the distance from each client to the center of the map (which should be your company HQ or similar).
Luckily, we already wrote a function to do this. All we need to do is pass it the coordinates for each client and the center. We can add the distance to each client with a computed property.
computed: {
  clients() {
    return this.rawClients.map((client) => {
      client.distance = this.distance(this.center, client.coords);
      return client;
    });
  },
},
With the above code, your Vue app now contains a clients array that contains all of your clients and the distance from center for each.
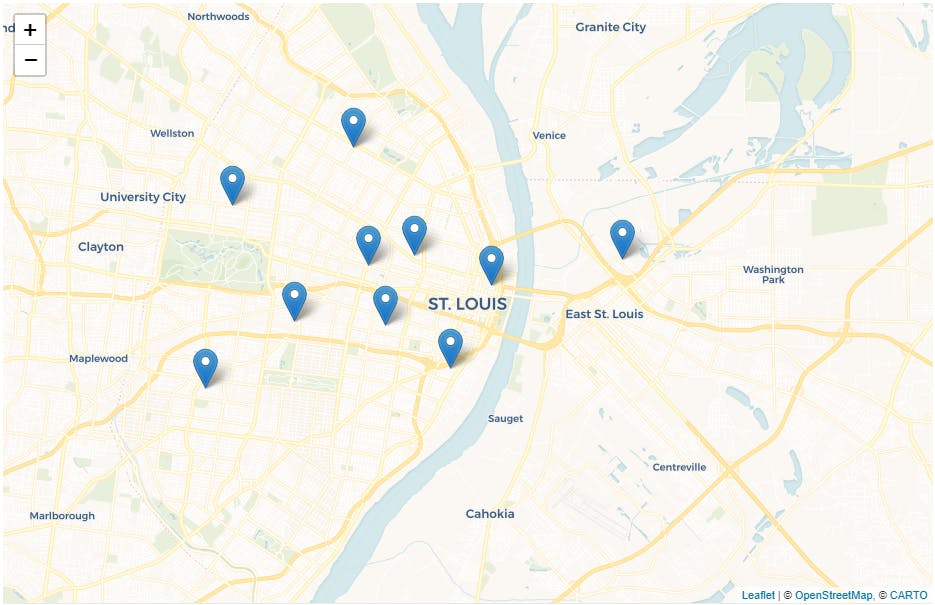
Now let’s create a map marker for each client. Back in initMap()…
initMap() {
  /* snip */

  this.clients.forEach((client) => {
    client.leafletObject = L.marker(client.coords)
      .bindPopup(`<strong>Client ${client.id}</strong><br>
                  Orders: ${client.orders}`);

    client.leafletObject.addTo(this.map);
});
If you load up index.html now, you’ll see a marker for each client on the map.
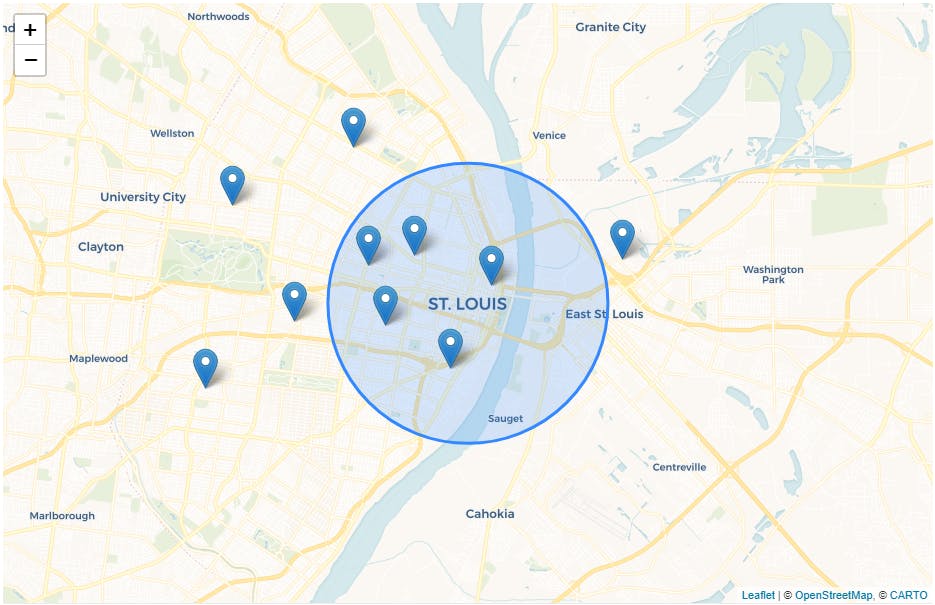
We can also add the semi-transparent “data-selection circle” now, too.
initMap() {
  /* snip */

  this.centerCircle = L.circle(this.center, {
    radius: this.radius,
  });

  this.centerCircle.addTo(this.map);
},

How about, by default, we set the circle to half the furthest distance. For this, we need a maxDistance computed property.
computed: {
  /* snip */

  maxDistance() {
    return this.clients.reduce((acc, cur) => {
      return cur.distance > acc ? cur.distance : acc;
    }, 0);
  },
},
This computed property uses [Array.reduce()](developer.mozilla.org/en-US/docs/Web/JavaSc..) to loop through the clients array and return the distance with the highest value.
Back in initMap()…
initMap() {
  /* snip */

  this.radius = this.maxDistance / 2;
},
By default, the center circle’s radius is now set to half the maximum distance. But we also want to be able to adjust this value at runtime. For that, we’ll have to add a range input.
In the HTML, above <div id="map">, add…
<input class="form-control"
       type="range"
       min="0"
       :max="maxDistance"
       v-model="radius">

<h2 class="text-center">{{ radius }}</h2>
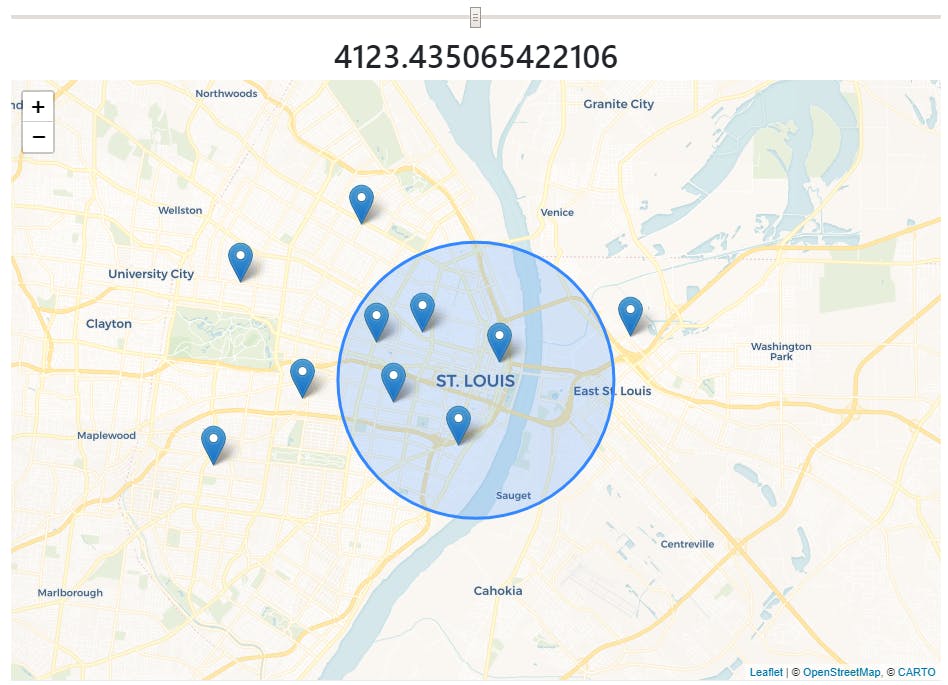
If you move the range input slider, the number below it (the radius) changes. The circle doesn’t get redrawn, yet, but we’ll get to that.
First, let’s work on formatting that incredibly precise radius value. I know that this number is in meters, because that’s what our distance() method returns.
We can format the number with a filter. In HTML, apply a filter to the number.
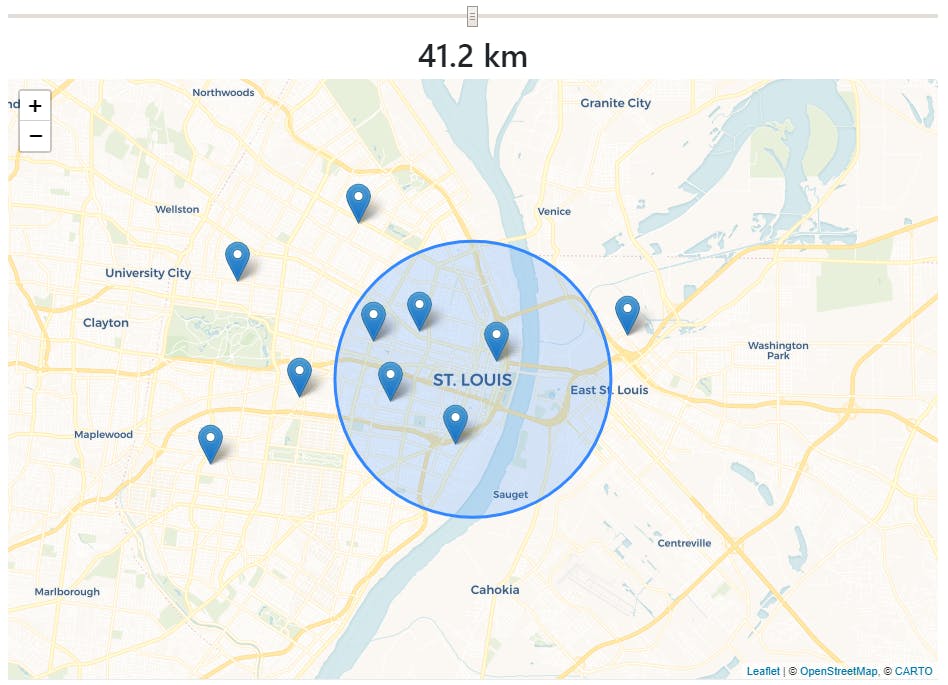
<h2 class="text-center">{{ radius **| km **}}</h2>
Now, in the Vue app, add the filter.
filters: {
  km(m) {
    const km = (m / 100).toFixed(1);
    return `${km} km`;
  },
},
This filter takes an input in meters, divides it by 100, rounds it to one decimal place, then adds the text “km” to the end. The result is a more user-friendly value displayed.
In order to redraw the semi-transparent circle, we must use a watcher.
watch: {
  radius() {
    this.centerCircle.setRadius(this.radius);
  },
},
When the radius property changes, setRadius() is called on centerCircle with the new value. This means the map gets visually updated.
You can drag the slider and watch the circle change.
All of this looks cool, but it’s not very useful, yet.
What we really want is to display data about clients that are within the selected radius. Let’s use a computed property to get those clients.
computed: {
  /* snip */

  clientsInRadius() {
    return this.clients.filter((client) => {
      return client.distance <= this.radius;
    });
  },
},
This computed property uses [Array.filter()](developer.mozilla.org/en-US/docs/Web/JavaSc..) to pick out only the clients whose distance is less than or equal to the selected radius.
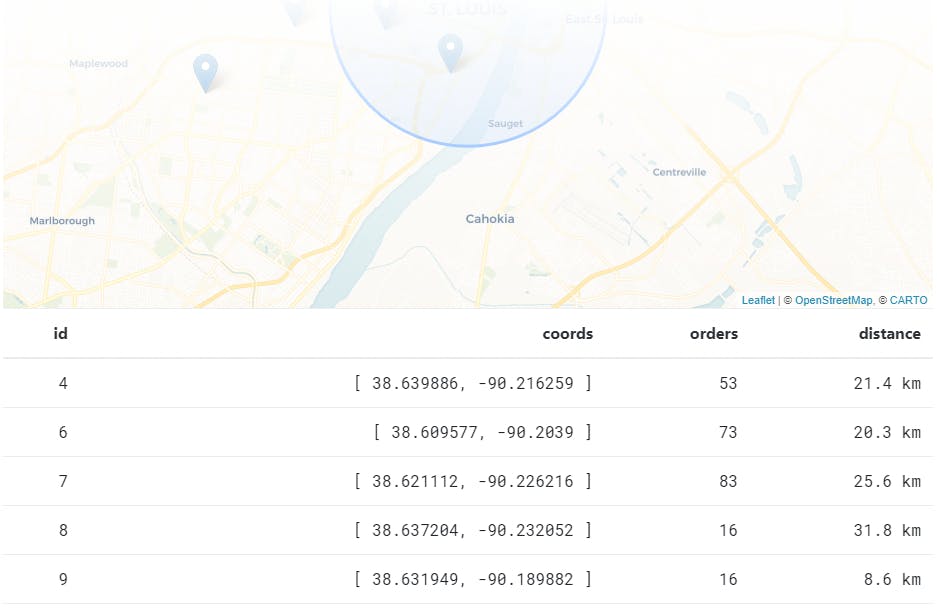
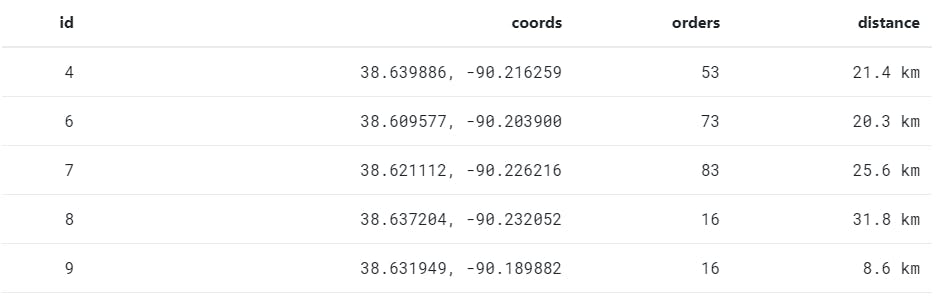
This array would look good displayed in a table below the map. In HTML, after <div id="map">…
<table class="table">
  <thead>
    <tr>
      <th>id</th>
      <th>coords</th>
      <th>orders</th>
      <th>distance</th>
    </tr>
  </thead>
  <tbody>
    <tr v-for="client in clientsInRadius" key="client.id">
      <td>{{ client.id }}</td>
      <td>{{ client.coords | coords }}</td>
      <td>{{ client.orders }}</td>
      <td>{{ client.distance | km }}</td>
    </tr>
  </tbody>
</table>
Now this is pretty cool. Only the clients within the radius are shown in the table. You can adjust the range input slider and watch table rows appear and disappear.
There is a small UX issue in that the circle stops directly on the client with the maximum distance. It annoyingly might not look like this client is covered in the circle.
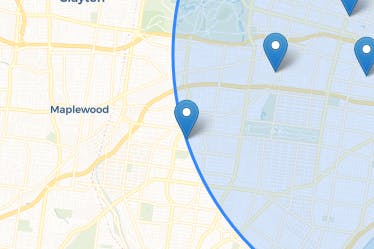
It’s not a huge issue, but it would feel much better to be able to expand the circle and really make sure this client is covered. To fix this, we can just add 100 meters to the maxDistance.
maxDistance() {
  return this.clients.reduce((acc, cur) => {
    return cur.distance > acc ? cur.distance : acc;
  }, 0)** + 100**;
},
With this fix in place, when you slide the slider all the way to max, the user can be sure this furthest client is covered.
Another UX improvement is to normalize the GPS coordinates in the data table. Use a filter for this.
filters: {
  /* snip */

  coords(c) {
    const lat = c[0].toFixed(6);
    const lng = c[1].toFixed(6);

    return `${lat}, ${lng}`;
  },
},
And in the <table>:
<td>{{ client.coords | coords }}</td>
The coordinates are much easier to read this way.
Finally, it would be great to see the total number of orders for all the clients currently shown (all the clients in the selected radius). Another computed property can do this.
computed: {
  /* snip */

  ordersInRadius() {
    return this.clientsInRadius.reduce((acc, cur) => {
      return acc + cur.orders;
    }, 0);
  },
},
Place this computed property at the bottom of the <table> like so.
<table class="table">
  <!-- snip -->
  <tbody>
    <!-- snip -->
    **<tr>
      <td></td>
      <td></td>
      <td>
        <strong>{{ ordersInRadius }}</strong>
      </td>
      <td></td>
    </tr>**
  </tbody>
</table>
Basically, we add a new row to the bottom of the table that is made up of empty cells except for the orders column.
The end result is a web app that allows the user to adjust the radius. As they do, the map and the table reflect the adjustment.