 Travis Horn
Interactive Maps with Vue & Leaflet

This post will cover the basics of interactive maps using Vue.js and Leaflet.
If you’ve never heard of Vue, it’s a popular front-end framework for building user interfaces. If you’ve never heard of Leaflet, it’s a modern JavaScript library that makes working with maps easy.
Today, we’ll use those frameworks to build a web app with a couple components:
- An interactive geographic map that users can pan and zoom
- A collection of “layer” checkboxes that users can toggle to view markers and polygons on the map
To start, create a file called index.html with the following boilerplate code:
<!doctype html>
<html lang="en">
  <head>
    <title>Interactive Map</title>
    <meta charset="utf-8" />
    <meta
      name="viewport"
      content="width=device-width, initial-scale=1, shrink-to-fit=no"
    />
  </head>
  <body></body>
</html>
As far as CSS goes, we’ll simply use Bootstrap
4. Add this line to the head section.
<link
  rel="stylesheet"
  href="https://cdnjs.cloudflare.com/ajax/libs/twitter-bootstrap/4.0.0-beta/css/bootstrap.min.css"
/>
Leaflet requires its own styles. Include its stylesheet, as well.
<link
  rel="stylesheet"
  href="https://unpkg.com/leaflet@1.2.0/dist/leaflet.css"
/>
In the body section, include both Vue and Leaflet.
<script src="https://cdnjs.cloudflare.com/ajax/libs/vue/2.3.4/vue.min.js"></script>
<script src="https://unpkg.com/leaflet@1.2.0/dist/leaflet.js"></script>
All libraries are now loaded! We can begin coding our app. Again, in the body
section, above the two script tags, create a div like so.
<div id="app" class="container">
  <!-- The rest of the app goes here -->
</div>
We gave this div an id so we can bind our Vue app to it and we gave it the
container class so we can use Bootstrap’s grid system within it.
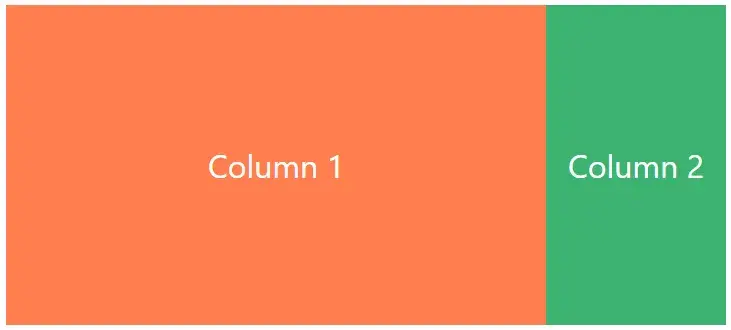
Inside that div, set up a row and two columns.
<div id="app" class="container">
  <div class="row">
    <div class="col-md-9">
      <!-- The map goes here -->
    </div>

    <div class="col-md-3">
      <!-- The layer checkboxes go here -->
    </div>
  </div>
</div>
We now have one row that contains two columns. The first column takes up 9 (out of 12) column widths. The second column takes up 3.
The first column will contain the map. Add a new div inside it to indicate
where the map should go.
<div id="map" class="map"></div>This div has an id that we’ll use to bind our Leaflet map. It also contains
a class that we can reference in CSS.
We’ll leave this template as it is for right now and come back to it later.
Leaflet requires our map element to have a height. We can do this three ways:
- Directly on the element with a
styleattribute - In a
styletag inside theheadsection - Create a new CSS stylesheet (.css file) and link it in the
headsection
The first one is the easiest, but the second or third options are better
practices. Personally, I recommend the third option. For that, simply create a
new file call styles.css
.map {
  height: 600px;
}
Then, link it in the head section below Bootstrap.
<link rel="stylesheet" href="styles.css" />That’s really the only custom style we need for the basic setup. But feel free to add additional styles in this file later.
Now we’re ready to write some JavaScript. Create a new file called app.js.
new Vue({
  el: "#app",

  data: {
    /* Data properties will go here */
  },

  mounted() {
    /* Code to run when app is mounted */
  },

  methods: {
    /* Any app-specific functions go here */
  },
});
Then, include it in the body section, below the existing script tags.
<script src="app.js"></script>Inside the data object, add these three properties.
data: {
  map: null,
  tileLayer: null,
  layers: [],
},
map will become a reference to the Leaflet map, tileLayer will become a
reference to the tile layer (actual map visuals), and the layers array will
eventually contain objects for each of our toggle-able layers.
In the mounted() function, execute this.initMap() and this.initLayers().
mounted() {
  this.initMap();
  this.initLayers();
},
Neither of these methods exist, yet. Create them in the methods object.
methods: {
  initMap() {},
  initLayers() {},
},
Inside initMap(), we set the this.map and this.tileLayer properties. Then,
add the tile layer to the map.
this.map = L.map("map").setView([38.63, -90.23], 12);
this.tileLayer = L.tileLayer(
"https://cartodb-basemaps-{s}.global.ssl.fastly.net/rastertiles/voyager/{z}/{x}/{y}.webp",
{
maxZoom: 18,
attribution:
'© <a href="https://www.openstreetmap.org/copyright">OpenStreetMap</a>, © <a href="https://carto.com/attribution">CARTO</a>',
},
);
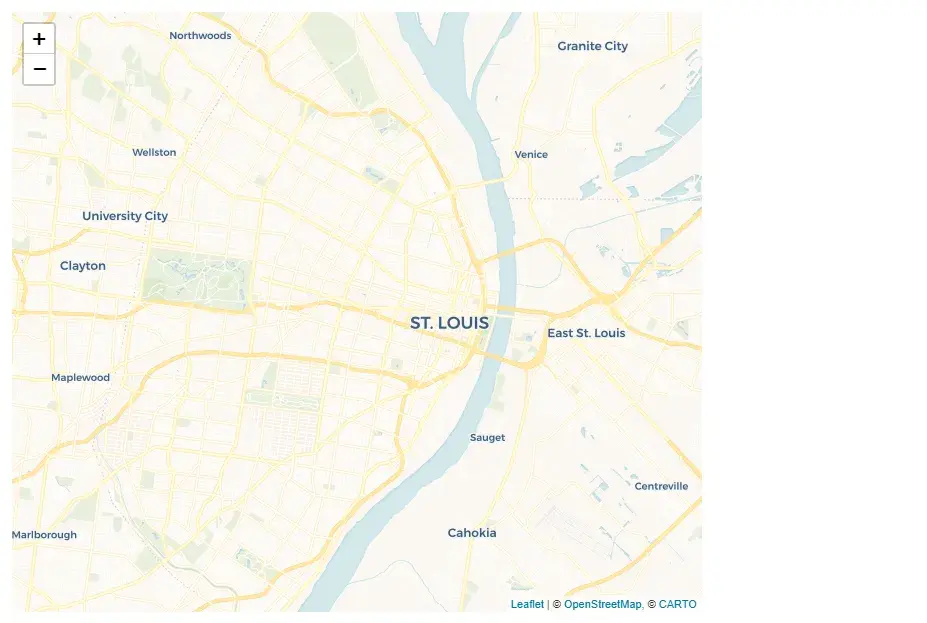
this.tileLayer.addTo(this.map);The first line is simple. It uses Leaflet (the L object) to bind a new map to
the div id="map" element, then sets the view to be at latitude 38.63 and
longitude -90.23 with a zoom level of 12. This sets the map to be zoomed in
right over Saint Louis, MO.
The second line is more complicated. It sets the tile layer, which you can think of as a collection of images which outline streets, rivers, city names, and other visual aspects of a map.
The tiles we use here are a free services of Carto. First we pass the URL template for the tiles, then an options object. The options we set here are:
- maxZoom — specifies how far the user should be able to zoom in.
- attribution — When using Carto’s tiles, you must give attribution. Basically this adds a description of the copyrights associated with these tiles.
For the first time, our app should actually look like something. If you load
index.html in your browser, you should see a map of Saint Louis, MO.
Now for the toggle-able layers.
Inside the layers property, add a new object to describe our layer.
data: {
  map: null,
  tileLayer: null,
  layers: [
    {
      id: 0,
      name: 'Restaurants',
      active: false,
      features: [],
    },
  ],
},
Each layer will have…
id— Just a unique identifier for the layer. This can be as simple as an incrementing integername— The name of the layer that we can use to display in the appactive— Whether or not the user has toggled the layer onfeatures— An array of objects that define markers or polygons in the layer
The objects in the features array look like this:
features: [
  {
    id: 0,
    name: 'Bogart\'s Smokehouse',
    type: 'marker',
    coords: [38.6109607, -90.2050322],
  },
],
Each feature will have…
id— Another unique identifier. Note that it only has to be unique to other features.name— The name of the feature (a restaurant in this case) to display in the apptype— In this app, features can either be markers or polygons. A marker will appear as a “tack” on the map. A polygon will appear as a semi-transparent colored shape.coords— The latitude and longitude for the feature
Below you will find a collection of restaurant feature objects that you can copy & paste. These are just some sample restaurants from around the Saint Louis area.
{
id: 0,
name: 'Bogart\'s Smokehouse',
type: 'marker',
coords: [38.6109607, -90.2050322],
},
{
id: 1,
name: 'Pappy\'s Smokehouse',
type: 'marker',
coords: [38.6350008, -90.2261532],
},
{
id: 2,
name: 'Broadway Oyster Bar',
type: 'marker',
coords: [38.6188362, -90.1947098],
},
{
id: 3,
name: 'Charlie Gitto\'s On the Hill',
type: 'marker',
coords: [38.617972, -90.2756436],
},
{
id: 4,
name: 'Sugarfire',
type: 'marker',
coords: [38.6304077, -90.1916921],
},
{
id: 5,
name: 'The Shaved Duck',
type: 'marker',
coords: [38.6036282, -90.2381407],
},
{
id: 6,
name: 'Mango Restaurant',
type: 'marker',
coords: [38.6313642, -90.1961267],
},
{
id: 7,
name: 'Zia\'s Restaurant',
type: 'marker',
coords: [38.6157376, -90.27716],
},
{
id: 8,
name: 'Anthonio\'s Taverna',
type: 'marker',
coords: [38.6143846, -90.280048],
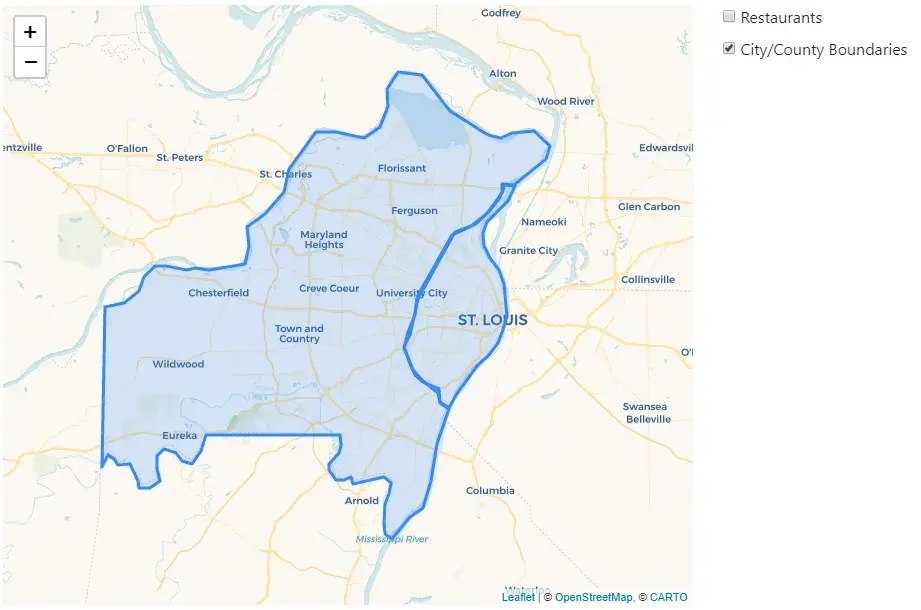
},The second layer we’ll add is the boundaries for the City of Saint Louis and St. Louis County. Add this new layer.
layers: [
  {
    id: 0,
    name: 'Restaurants',
    active: false,
    features: [ /* snip */ ],
  },
  {
    id: 1,
    name: 'City/County Boundaries',
    active: false,
    features: [],
  },
],
This layer will have two features. Both of them are polygons. Polygon features are nearly identical to marker features except…
typeis'polygon'instead of'marker'coordsis an array of arrays, instead of just a single array. This is because the polygons are more than just a single point on a map. They are a collection of points that define a shape.
You can just copy & paste these two features.
features: [
  {
    id: 0,
    name: 'City of St. Louis',
    type: 'polygon',
    coords: [
      [38.770547, -90.168056],
      [38.753816, -90.177326],
      [38.747390, -90.183849],
      [38.731456, -90.206337],
      [38.719805, -90.212002],
      [38.706142, -90.210629],
      [38.692879, -90.202217],
      [38.680150, -90.189857],
      [38.665139, -90.182991],
      [38.646774, -90.179729],
      [38.630818, -90.179214],
      [38.615663, -90.183849],
      [38.601713, -90.190201],
      [38.587759, -90.204620],
      [38.577427, -90.219212],
      [38.564140, -90.232258],
      [38.545615, -90.248566],
      [38.531650, -90.257664],
      [38.538901, -90.270023],
      [38.548702, -90.273113],
      [38.561053, -90.294399],
      [38.574072, -90.309334],
      [38.596346, -90.320320],
      [38.614054, -90.314827],
      [38.632159, -90.304527],
      [38.651198, -90.302296],
      [38.664067, -90.293713],
      [38.683768, -90.278263],
      [38.700650, -90.265388],
      [38.717662, -90.253887],
      [38.722349, -90.238266],
      [38.729715, -90.221272],
      [38.742302, -90.203934],
      [38.754886, -90.191746],
      [38.764792, -90.184021],
      [38.771350, -90.183334],
    ],
  },{
    id: 1,
    name: 'St. Louis County',
    type: 'polygon',
    coords: [
      [38.771216, -90.169601],
      [38.786740, -90.144196],
      [38.799049, -90.124283],
      [38.813496, -90.118790],
      [38.829010, -90.141449],
      [38.827405, -90.170975],
      [38.821521, -90.186081],
      [38.824731, -90.204620],
      [38.850938, -90.257492],
      [38.863771, -90.271912],
      [38.888361, -90.294571],
      [38.892102, -90.327530],
      [38.873929, -90.343323],
      [38.856285, -90.342636],
      [38.833289, -90.352936],
      [38.821521, -90.374908],
      [38.827940, -90.413361],
      [38.828475, -90.441513],
      [38.788345, -90.477905],
      [38.763186, -90.484772],
      [38.740695, -90.510178],
      [38.726233, -90.535583],
      [38.705339, -90.532837],
      [38.686046, -90.538330],
      [38.679614, -90.587769],
      [38.682294, -90.606308],
      [38.679614, -90.617981],
      [38.683902, -90.646820],
      [38.684438, -90.661926],
      [38.672645, -90.676346],
      [38.658169, -90.683899],
      [38.645299, -90.704498],
      [38.640473, -90.731277],
      [38.468106, -90.735397],
      [38.481545, -90.726471],
      [38.477782, -90.717545],
      [38.471331, -90.712738],
      [38.471869, -90.696945],
      [38.463267, -90.692139],
      [38.453051, -90.684586],
      [38.446060, -90.683899],
      [38.446598, -90.669479],
      [38.454126, -90.655060],
      [38.466493, -90.659180],
      [38.480470, -90.659180],
      [38.488532, -90.650253],
      [38.483695, -90.633087],
      [38.474557, -90.624161],
      [38.472406, -90.611115],
      [38.485845, -90.598755],
      [38.502505, -90.592575],
      [38.503042, -90.407181],
      [38.492294, -90.406494],
      [38.484232, -90.409241],
      [38.478320, -90.416107],
      [38.472406, -90.422287],
      [38.465418, -90.422287],
      [38.454664, -90.413361],
      [38.454664, -90.401688],
      [38.458428, -90.392761],
      [38.450900, -90.390015],
      [38.452513, -90.374908],
      [38.457353, -90.348129],
      [38.451438, -90.337830],
      [38.439069, -90.340576],
      [38.428849, -90.346069],
      [38.418628, -90.347443],
      [38.408406, -90.347443],
      [38.396568, -90.345383],
      [38.391186, -90.336456],
      [38.414862, -90.311737],
      [38.424546, -90.293198],
      [38.453051, -90.282898],
      [38.492832, -90.273972],
      [38.510565, -90.268135],
      [38.531516, -90.258522],
      [38.537693, -90.270538],
      [38.544138, -90.272598],
      [38.552730, -90.272598],
      [38.559710, -90.293541],
      [38.568032, -90.304871],
      [38.577695, -90.311050],
      [38.586552, -90.314827],
      [38.597285, -90.319977],
      [38.609896, -90.311737],
      [38.635646, -90.305557],
      [38.649321, -90.301437],
      [38.701856, -90.264702],
      [38.714447, -90.255089],
      [38.721144, -90.249939],
      [38.724358, -90.237579],
      [38.727572, -90.227623],
      [38.734536, -90.214920],
      [38.740963, -90.204620],
      [38.747925, -90.198097],
      [38.756225, -90.189514],
      [38.763721, -90.185051],
      [38.771752, -90.184708],
    ],
  },
],
Back in our HTML template, we’ll create a checkbox for each layer. This code
goes inside that second column ( div class="col-md-3")
<div class="form-check" v-for="layer in layers" :key="layer.id">
  <!-- label and input elements go here -->
</div>
The code above creates a new div class="form-check" for each layer in the
layers array.
This div contains a label and an input element.
<label class="form-check-label">
  <input
    class="form-check-input"
    type="checkbox"
    v-model="layer.active"
    @change="layerChanged(layer.id, layer.active)"
  />
  {{ layer.name }}
</label>
In the code above, v-model binds the active property to the checkbox’s
value. This means that when active === true the checkbox will be checked and
vice-versa.
Also, when the value of the checkbox is changed, layerChanged() is called with
the id of the layer and whether is it now active or not. We haven’t created
this function, yet, but we’ll get to it.
Finally, we use Vue’s text interpolation to place the name of the layer inside the label.
That’s it for the HTML template. Back in JavaScript, add a layerChanged()
function to the methods object.
methods: {
initMap() { /* snip */ },
initLayers() { /* snip */ },
layerChanged(layerId, active) { },
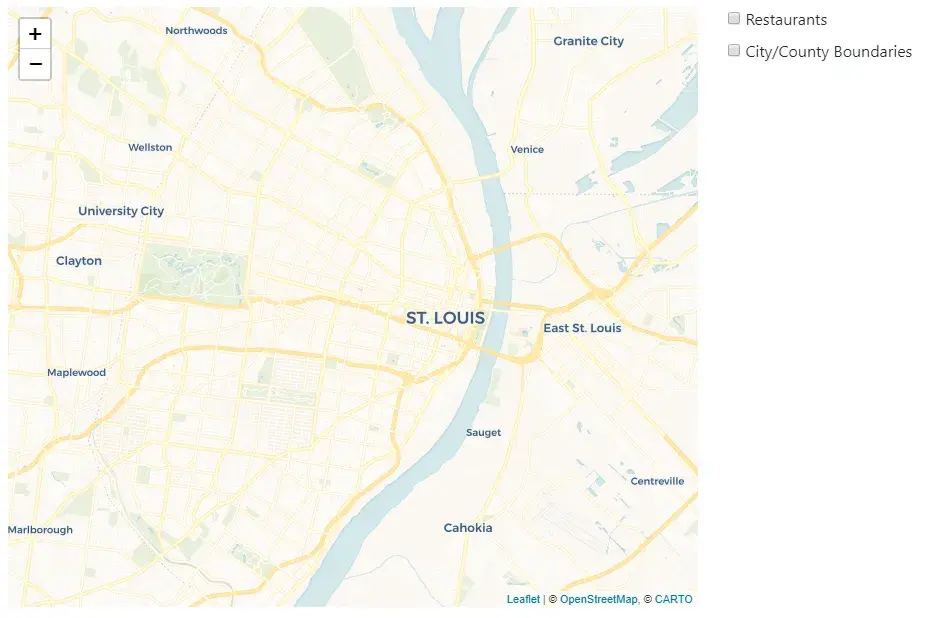
},At this point, if you save and load the page, there should be a checkbox for each layer next to the map.
Before we can write the code to toggle the layers, we have to initialize them.
It’s time to code the initLayers() method. The basic idea behind this method
is to add Leaflet objects for each feature.
Loop through each layer.
initLayers() {
  this.layers.forEach((layer) => {
    // Initialize the layer
  });
},
In the loop, create two arrays. One for all the marker features and one for all the polygon features in the layer.
const markerFeatures = layer.features.filter(
  (feature) => feature.type === "marker",
);

const polygonFeatures = layer.features.filter(
  (feature) => feature.type === "polygon",
);
Now loop over the marker features and create Leaflet objects for each.
markerFeatures.forEach((feature) => {
  feature.leafletObject = L.marker(feature.coords).bindPopup(feature.name);
});
Loop over the polygon features and create Leaflet objects for them, too.
polygonFeatures.forEach((feature) => {
  feature.leafletObject = L.polygon(feature.coords).bindPopup(feature.name);
});
All features in all layers now contain a leafletObject that we can use. With
all layers “initialized,” we can finally code the layerChanged() method.
layerChanged(layerId, active) {
  /* Show or hide the features in the layer */
},
First, get a reference to the layer that was toggled.
const layer = this.layers.find((layer) => layer.id === layerId);Now loop over the features in the layer.
layer.features.forEach((feature) => {
  /* Show or hide the feature depending on the active argument */
});
Inside the loop, check to see if the layer was made active. If so, add the feature to the map. Otherwise, remove it from the map.
if (active) {
feature.leafletObject.addTo(this.map);
} else {
feature.leafletObject.removeFrom(this.map);
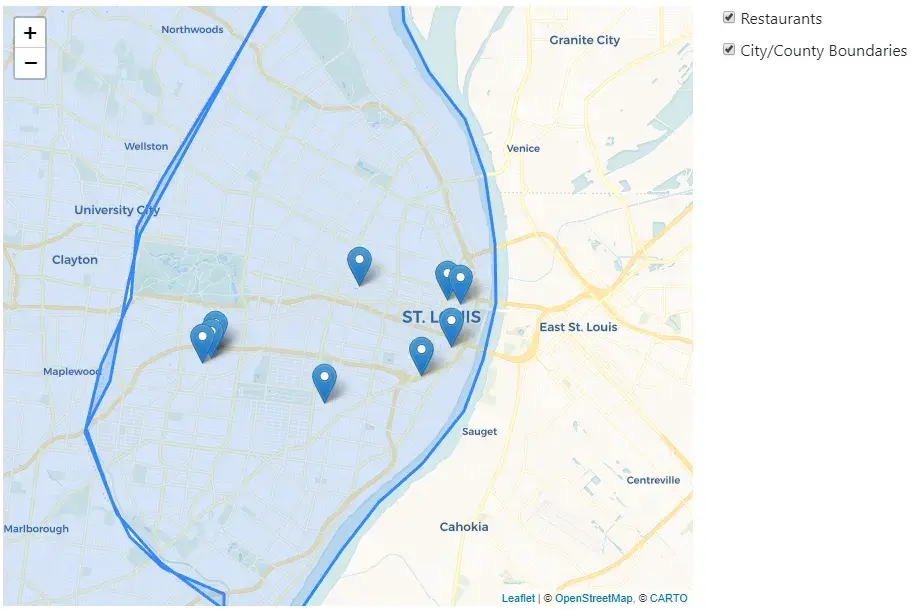
}That’s it! When you check the Restaurants checkbox, markers appear for each restaurant.
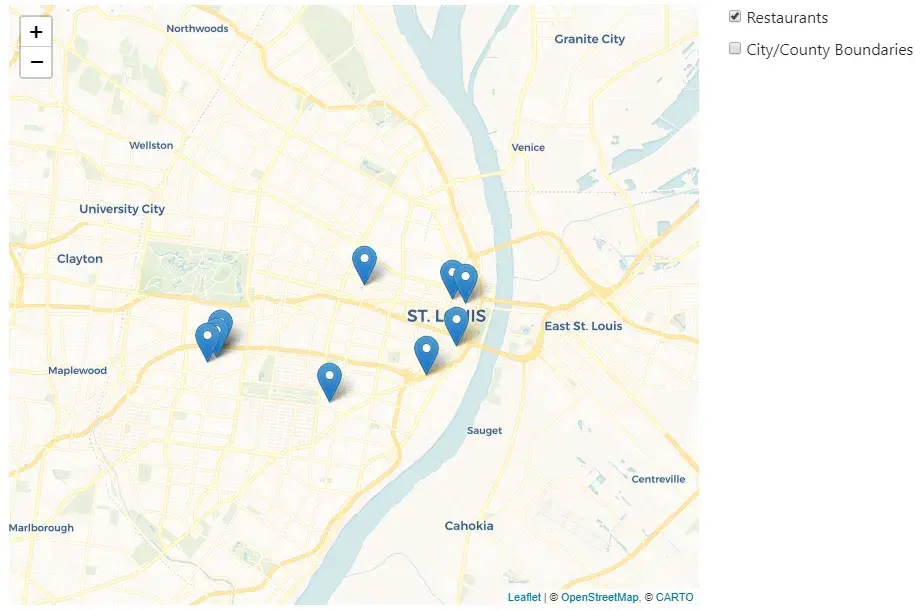
Similarly, when you check the City/County Boundaries checkbox, the polygons for each boundary are shown.
Of course, you can also check both at the same time.
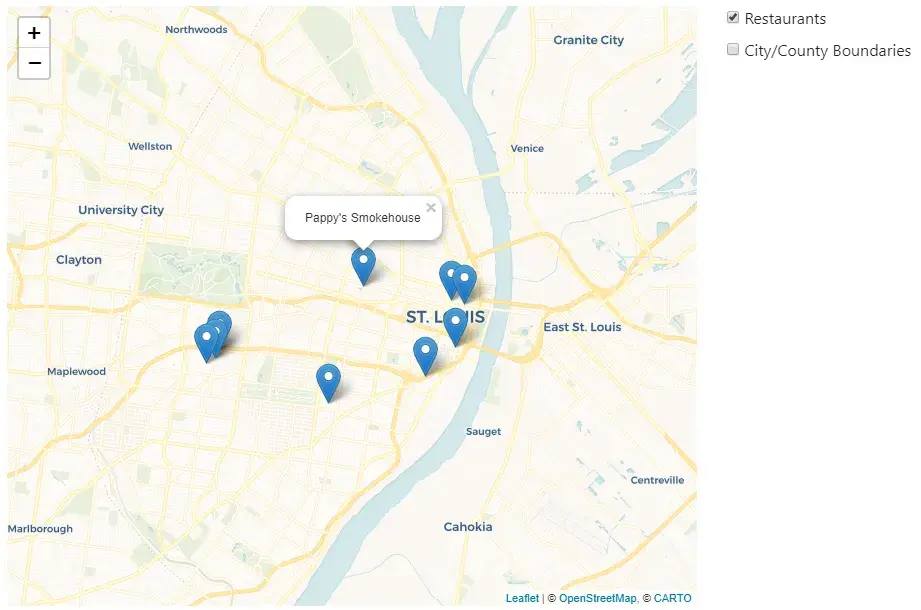
And because we bound popups to each feature, clicking one of them will pop up the name of that feature.
Adding new layers and features are as easy as adding new objects to the appropriate array. Just follow the format of the already existing ones.