 Travis Horn
SvelteKit Magic: Server-Side Rendering for Observable Plot Explained

Using a web application framework like SvelteKit opens up possibilities to bring your data visualizations to life on the server side before sending them to the client. In this guide, we’ll walk through some of the secrets of server-side rendering (SSR) for plots created with Observable Plot inside the SvelteKit framework. If you’re looking to enhance the performance and user experience of your web app by seamlessly rendering charts on the server, you’re in the right place.
SvelteKit is a framework for rapidly developing robust, performant web applications using Svelte. If you’re coming from React, SvelteKit is similar to Next. If you’re coming from Vue, SvelteKit is similar to Nuxt.
Observable Plot is a free, open-source, JavaScript library for visualizing tabular data, focused on accelerating exploratory data analysis.
Say your web app requires dynamic and interactive data visualizations, but your users are being bogged down by slow load times and poor accessibility. Server-side rendering (SSR) provides a solution to this challenge. By generating plots on the server and sending them as pre-rendered HTML to the client, we can significantly improve the initial page load performance. This not only boosts the speed of your application but also ensures that users with varying device capabilities can access your visualizations easily. Read on to understand the process of integrating Observable Plot into SvelteKit, diving into the world of performant server-side rendering to deliver an enhanced user experience.
Create a new SvelteKit project
You may be able to skip this section if you already have a SvelteKit project that you’re working on. Otherwise, continue reading to create a new project.
Make sure you have Node.js installed. Then, open up a terminal and create a new SvelteKit project.
npm create svelte@latest plot-ssrI called the project plot-ssr, but feel free to change the name to anything you wish. The above command will guide you through some prompts to create your new project.
Need to install the following packages:
  create-svelte@5.1.1
Ok to proceed? (y) y

create-svelte version 5.1.1

┌  Welcome to SvelteKit!
│
◇  Which Svelte app template?
│  Skeleton project
│
◇  Add type checking with TypeScript?
│  Yes, using JavaScript with JSDoc comments
│
◇  Select additional options (use arrow keys/space bar)
│  none
│
└  Your project is ready!
Once created, change into the project directory.
cd plot-ssrInstall the dependencies.
npm installInitialize a new git repository (optional)
git init && git add -A && git commit -m "Initial commit"Start the development server
npm run dev -- --openThat last command should open the site in your web browser. If not, just go to http://localhost:5173.
Install the libraries
Keep the terminal with the development server running. Open up a new terminal and change into the project directory.
cd plot-ssrInstall Observable Plot and JSDOM (both are necessary for this solution).
npm install @observablehq/plot jsdomWrite the server-side code
Create a new file called src/routes/+page.server.js. Note that this file
should sit right next to the existing +page.svelte in the same directory.
// Import the necessary libraries
import * as Plot from "@observablehq/plot";
import { JSDOM } from "jsdom";
// Plot will need a reference to a DOM window document later in the code
const { document } = new JSDOM().window;
/** @type {import('./$types').PageServerLoad} */
export async function load() {
// Create your plot. Make sure the `document` property points to a DOM
// window document. Also make sure you are getting the `outerHTML`
// property (the line at the end).
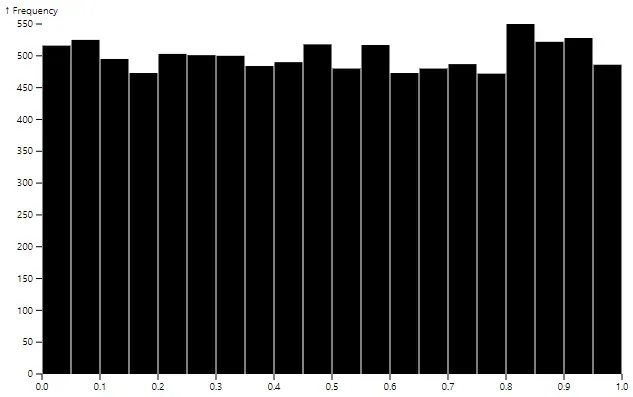
const plot = Plot.plot({
marks: [
Plot.rectY(
{ length: 10000 },
Plot.binX({ y: "count" }, { x: Math.random }),
),
],
document,
}).outerHTML;
// At this point, `plot` contains the HTML string representing the
// plotted chart. Return it.
return {
plot,
};
}This file uses SvelteKit’s load function to load data on the server, and then send it to the page for rendering.
Now, in +page.svelte, you can pick up the passed plot variable which
contains the HTML string for the plot.
<script>
  /** @type {import('./$types').PageData} */
  export let data;
</script>

{@html data.plot}
This file uses export let data to get a reference to the data passed in from
+page.server.js. The data object will contain the plot variable we
generated earlier.
Use data.plot with Svelte’s {@html ...}
tag to write HTML code directly to
the page.
Result
If you look at the page again (http://localhost:5173), you’ll see the plot.
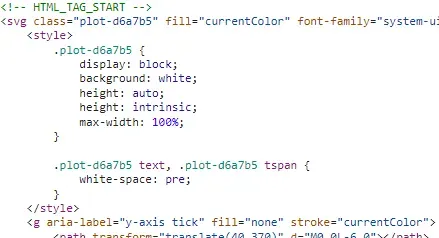
You can verify the HTML for the plot is sent directly from the server, and not just generated when the component is mounted by looking at the Network tab in Chrome’s DevTools:
- Press Ctrl + Shift + I
- Click on Network
- Refresh the page
- Scroll up and click on the row with the name of localhost, status of 200, and type of document
- Look at the Response tab. This is the response from the server. In it,
you can see the
<svg>element that makes up the plot.
Conclusion
You can use the knowledge gained here to open up possibilities for performant and dynamic data visualizations. When you adopt SSR, you optimize load times and create easier user experiences. Use this tool to ensure your visualizations shine with both functionality and speed.
All of the code for this article can be found on GitHub: travishorn/sveltekit-plot-ssr.